

Nucleosome organization of mouse embryos during pre-implantation development
- PMID: 40595944
- PMCID: PMC12217907
- DOI: 10.1038/s41598-025-05642-5
Nucleosome organization of mouse embryos during pre-implantation development
Abstract
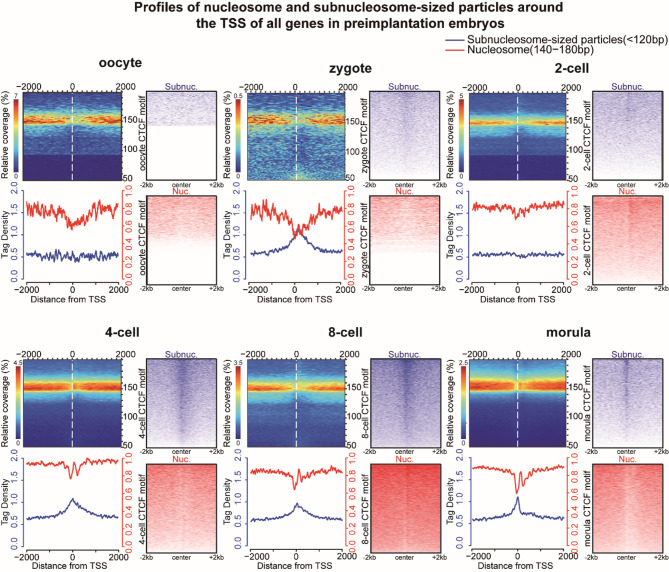
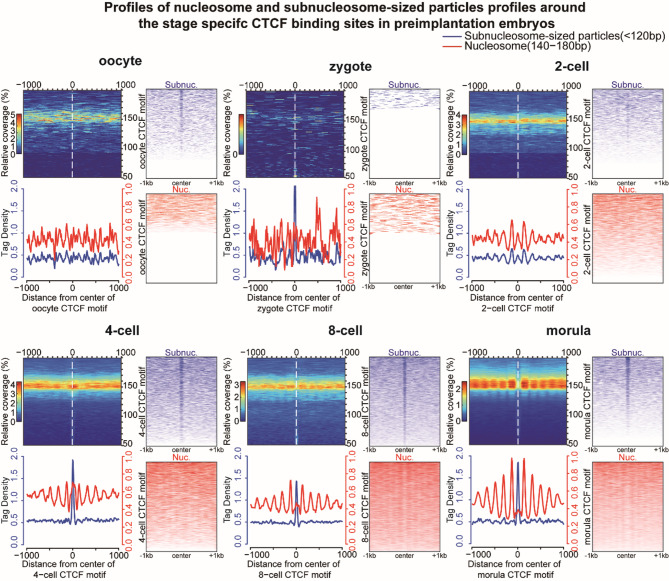
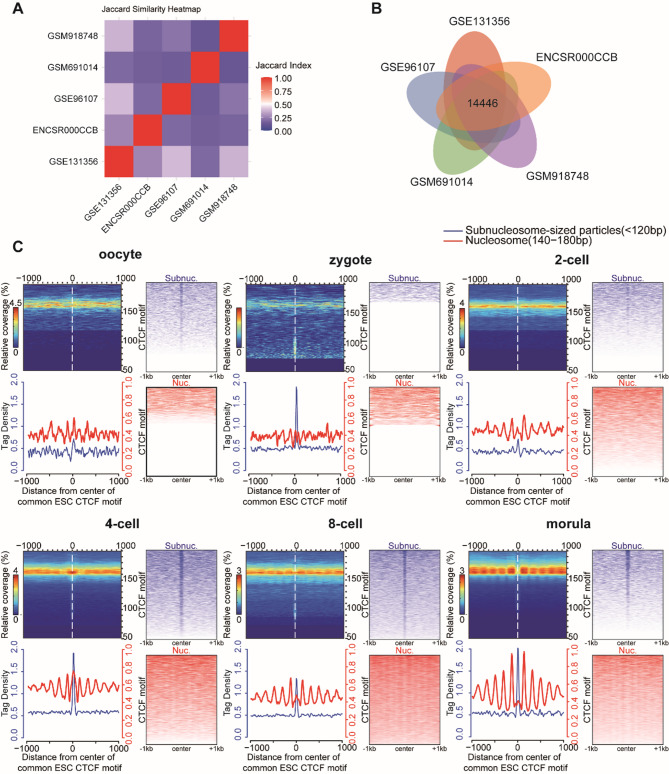
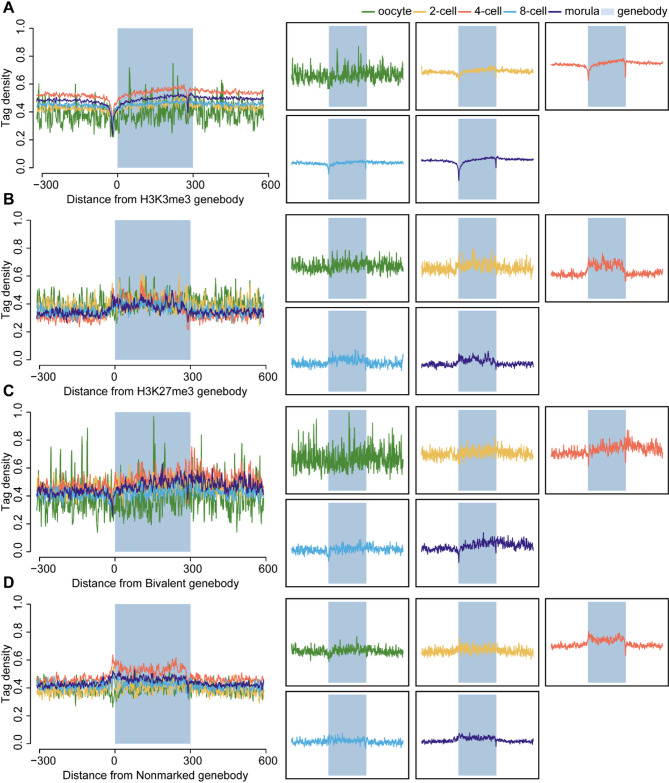
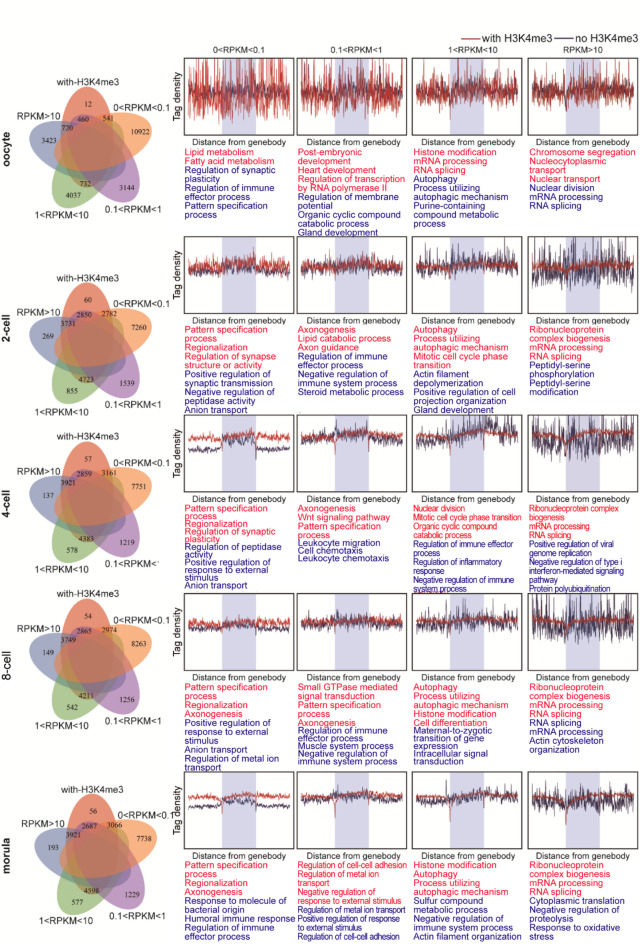
Sexual reproduction begins with sperm-oocyte fusion to form a zygote, where chromatin undergoes dramatic reorganization to establish totipotency. Although nucleosomes- the basic units of eukaryotic chromatin and key epigenetic regulators- are extensively remodeled during early embryogenesis, their dynamic repositioning mechanisms and biological implications remain unclear. Here, we employed single-cell MNase sequencing (scMNase-seq) to map genome-wide nucleosome positioning and chromatin accessibility in individual mammalian embryos. We found that nucleosome positioning mirrored somatic cell patterns until the 4-cell stage, with nucleosome depletion and phasing at CTCF sites not fully established until morula formation. By integrating H3K4me3 localization and transcriptomic data, we revealed that nucleosome sparsity at transcription start sites (TSS) and flanking regions correlated with expression levels of genes critical for preimplantation development. Notably, these nucleosome-depleted regions likely serve as regulatory hubs influencing histone modification dynamics. Our study systematically delineates nucleosome reorganization principles during mammalian embryogenesis and provides a high-resolution resource for understanding chromatin remodeling in early development.
Keywords: Chromatin organization; Embryos; H3K4me3; Nucleosome position; scMNase-seq.
© 2025. The Author(s).
Conflict of interest statement
Declarations. Competing interests: The authors declare no competing interests. Ethics approval and consent to participate: All animals were kept in a pathogen-free environment and fed ad lib. The procedures for care and use of animals were approved by the Ethics Committee of the Laboratory Animal Welfare and Ethics Committee of the Army Medical University (AMUWEC20224182) and all applicable institutional and governmental regulations concerning the ethical use of animals were followed.
Figures


Similar articles
-
nucMACC: An MNase-seq pipeline to identify structurally altered nucleosomes in the genome.Sci Adv. 2024 Jul 5;10(27):eadm9740. doi: 10.1126/sciadv.adm9740. Epub 2024 Jul 3. Sci Adv. 2024. PMID: 38959309 Free PMC article.
-
Nucleosome wrapping states encode principles of 3D genome organization.Nat Commun. 2025 Jan 3;16(1):352. doi: 10.1038/s41467-024-54735-8. Nat Commun. 2025. PMID: 39753536 Free PMC article.
-
Nucleosome density shapes kilobase-scale regulation by a mammalian chromatin remodeler.Nat Struct Mol Biol. 2023 Oct;30(10):1571-1581. doi: 10.1038/s41594-023-01093-6. Epub 2023 Sep 11. Nat Struct Mol Biol. 2023. PMID: 37696956 Free PMC article.
-
Reversible Histone Acetylation During Preimplantation Embryo Development in Mammals.Results Probl Cell Differ. 2025;75:165-188. doi: 10.1007/978-3-031-91459-1_6. Results Probl Cell Differ. 2025. PMID: 40593210 Review.
-
Beyond the mono-nucleosome.Biochem Soc Trans. 2025 Jan 31;53(1):BST20230721. doi: 10.1042/BST20230721. Biochem Soc Trans. 2025. PMID: 39887339 Free PMC article. Review.
References
-
- Hamatani, T., Carter, M. G., Sharov, A. A. & Ko, M. S. Dynamics of global gene expression changes during mouse preimplantation development. Dev. Cell.6(1), 117–131. 10.1016/s1534-5807(03)00373-3 (2004). - PubMed
-
- Yan, R. et al. Dynamics of DNA hydroxymethylation and methylation during mouse embryonic and germline development. Nat. Genet.55(1), 130–143. 10.1038/s41588-022-01258-x (2023). - PubMed
-
- Li, M. et al. Chromatin accessibility landscape of mouse early embryos revealed by single-cell NanoATAC-seq2. Science387(6741), eadp4319. 10.1126/science.adp4319 (2025). - PubMed
-
- Ke, Y. et al. 3D chromatin structures of mature gametes and structural reprogramming during mammalian embryogenesis. Cell170(2), 367-381.e20. 10.1016/j.cell.2017.06.029 (2017). - PubMed
MeSH terms
Substances
Grants and funding
LinkOut - more resources
Full Text Sources
