. 2025 Jul 2;15(1):22797.
doi: 10.1038/s41598-025-04670-5.

Multi-omics analysis of diabetic cardiomyopathy pathogenesis using a type 2 diabetic Zucker diabetic fatty rat model

Affiliations

Multi-omics analysis of diabetic cardiomyopathy pathogenesis using a type 2 diabetic Zucker diabetic fatty rat model

Kazuhiro Tanabe et al. Sci Rep. .

Abstract

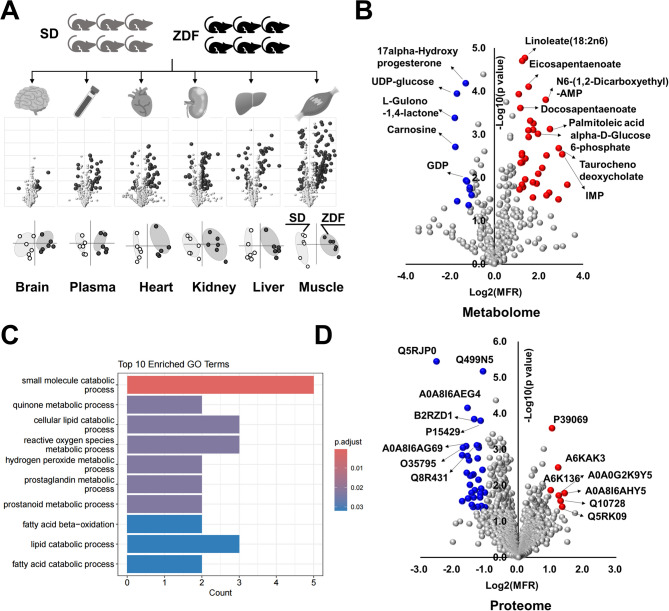
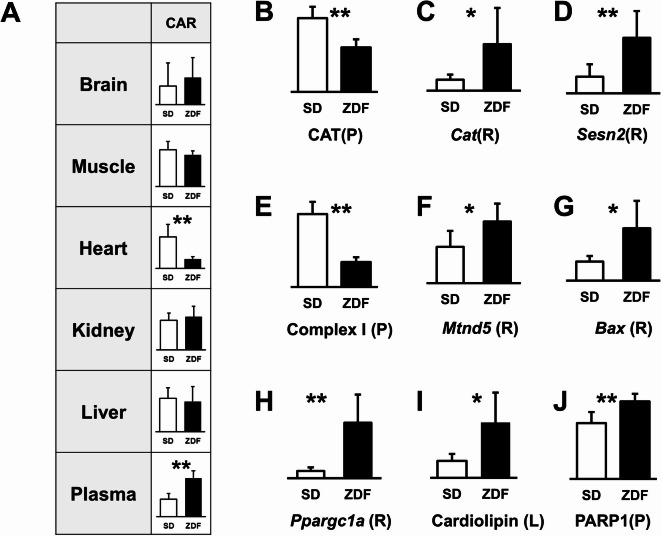
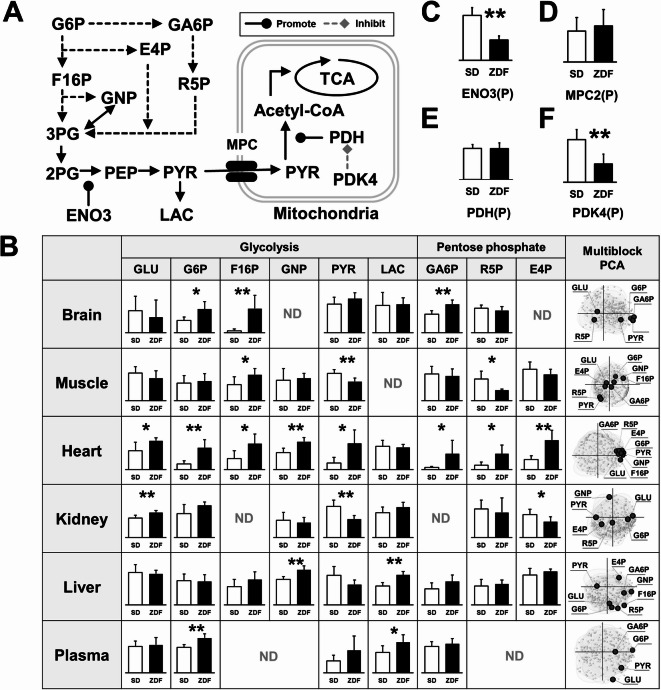
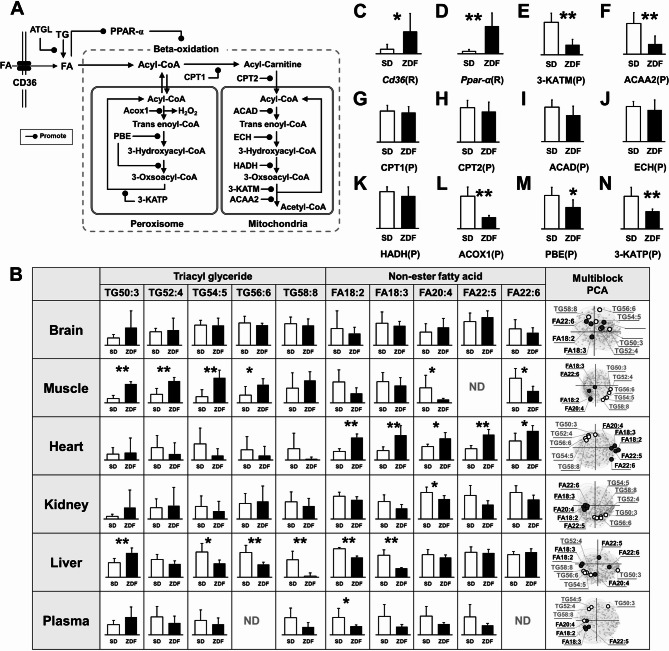
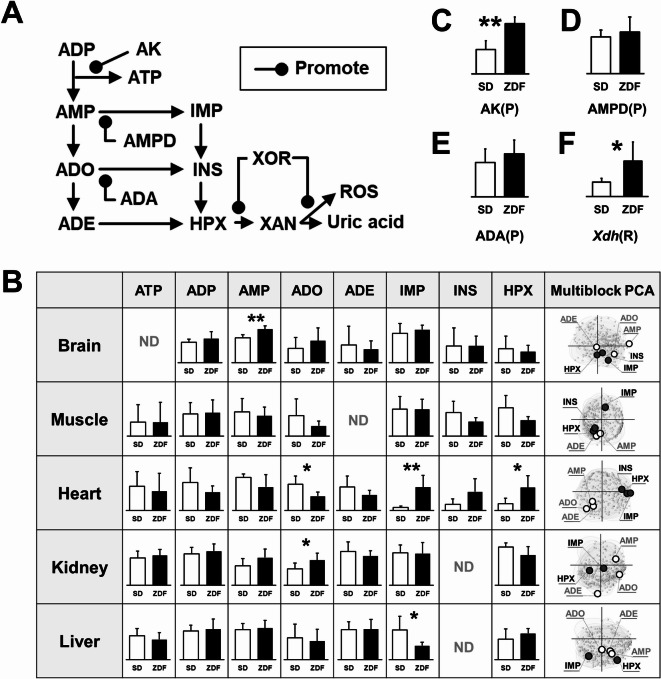
Diabetic cardiomyopathy (DCM) is a leading cause of mortality in patients with diabetes, highlighting the need to better understand its mechanisms for effective treatment. The primary pathogenic mechanism of DCM is mitochondrial dysfunction associated with increased oxidative stress; however, the exact reasons why diabetes triggers this condition remain unclear. An 8-week-old male Zucker diabetic fatty rat model of type 2 diabetes was used for this analysis. Metabolomic and lipidomic analyses were conducted not only in the heart but also across several other organs to elucidate metabolic changes specifically occurring in the heart. Proteomic analysis and gene expression profiling using qPCR were performed on the heart to achieve a comprehensive understanding. The marked reduction of the radical scavenger carnosine and the increased gene expression of catalase and Sestrin2 in the heart suggested elevated oxidative stress. A decrease in Complex I proteins and an increase in Complex I gene expression indicate rapid mitochondrial turnover in diabetic cardiomyocytes. Additionally, the increased expression of adenylate kinase and xanthine oxidoreductase accelerated the adenosine monophosphate degradation pathway, leading to reactive oxygen species generation. These insights into mitochondrial dysfunction and metabolic disturbances could inform the development of innovative therapies and pharmacological approaches for managing diabetic heart failure.

Keywords: Diabetic cardiomyopathy; Metabolomics; Mitochondrial disfunction; Oxidative stress; Proteomics; ROS.


Conflict of interest statement

Declarations. Competing interest: The authors declare no competing interests.

Figures

Fig. 1
Fig. 1
An overview of metabolism in the hearts of ZDF rats. (A) (upper) Experimental design of metabolomics and lipidomics. Six ZDF model rats and six SD rats (controls) were sacrificed, and metabolites and lipids in the brains, plasma, hearts, kidney, liver, and skeletal muscle were analyzed. Real-time PCR and proteomic analyses were conducted exclusively on heart tissue. (middle) Volcano plots of metabolites and lipids. Vertical axis represents -log10(Student t-test p-value), horizontal axis represents log2(Mean-fold ratio). P-values less than 0.05 and changes greater than a two-fold increase or decrease are highlighted in black. (lower) Score plots of multiblock PCA. Black dots represent ZDF rats, white dots represent SD rats. (B) Volcano plots of heart metabolism. Metabolites showing significant alterations are labeled with their names. P-values less than 0.05 and changes greater than a two-fold increase or decrease are highlighted in red and blue. (C) Enrichment analysis of GO Terms in proteomics. The bar chart displays the top 10 enriched Gene Ontology terms identified in a proteomics study. The x-axis represents the count of proteins associated with each GO term, while the y-axis lists the GO terms. (D) Volcano plots of heart proteins. Each Uniprot number represents the following proteins. A0A8I6AHY5:epiplakin 1, Q5RK09:eukaryotic translation initiation factor 3, Q10728:protein phosphatase1 regulatory, A0A0G2K9Y5:histidine-rich glycoprotein, A6KAK3:queuosine 5’-phosphate N-glycosylase/hydrolase, P39069:adenylate kinase isoenzyme 1, A6K136:protein phosphatase Mn(2 +)-dependent 1 K, Q499N5:medium-chain acyl-CoA ligase ACSF2, mitochondrial, P15429:beta-enolase, A0A8I6AG69:C3 and PZP-like, alpha-2-macroglobulin, Q8R431:monoglyceride lipase, B2RZD1:protein transport protein Sec61, A0A8I6AEG4:NADH: ubiquinone oxidoreductase, O35795:ectonucleoside triphosphate diphosphohydrolase 2, Q5RJP0:aldo–keto reductase family 1 member B7.
Fig. 2
Fig. 2
Oxidative stress and mitochondrial functions in cardiomyocytes. (A) Carnosine levels (CAR) in the brain, skeletal muscle, heart, kidney, liver, and plasma. (B) Protein expression of catalase (CAT). (C) mRNA levels of CAT. (D) mRNA levels of Sestrin2 (Sesn2). (E) Protein levels of NADH dehydrogenase (Complex I). (F) mRNA levels of mtND5, encoding a subunit of NADH dehydrogenase (Complex I). (G) mRNA levels of Bcl-2-associated X protein (BAX). (H) mRNA levels of peroxisome proliferator-activated receptor gamma coactivator-1 alpha (PGC-1α). (I) Relative lipid content of cardiolipin in tissues. (J) Protein expression of PARP1. Black bars represent Zucker Diabetic Fatty (ZDF) rats, and white bars represent Sprague Dawley (SD) controls. All bar graphs show relative measurements in respective tissues. Significance levels are indicated as ** for p < 0.01 and * for p < 0.05. Legend keys: (P) denotes protein expressions analyzed by proteomics, (R) denotes gene expressions analyzed by real-time PCR, and (L) denotes lipid quantities analyzed by lipidomics.
Fig. 3
Fig. 3
Glucose metabolism in the heart of Zucker Diabetic Fatty (ZDF) rats. (A) Simplified diagram of glycolysis, the pentose phosphate pathway, and mitochondrial metabolism: Solid lines represent direct conversion, while dotted lines indicate multiple metabolic reactions between steps. (B) Relative abundance of metabolites and multiblock PCA loading plots: Black bars: ZDF rats, White bars: SD rats. Error bars indicate a standard deviation of six samples. Loading plots in multiblock PCA illustrate the relative similarities in metabolite expression. GLU: glucose, G6P: gluctose-6-phosphate, F16P: fructose-1,6-phospate, GNP: glycerone phosphate, PYR: pyruvate, LAC: lactate, GA6P: gluconate 6-phosphate, R5P: ribulose 5-phosphate, E4P: erythrose 4-phosphate. (C) Protein expression of beta-enolase (ENO3). (D) Protein expression of mitochondrial pyruvate carrier 2 (MPC2). (E) Protein expression of pyruvate dehydrogenase (PDH). (F) Protein expression of pyruvate dehydrogenase kinase 4 (PDK4), Significance levels are indicated as *: p < 0.05, **: p < 0.01. ND: not detected.
Fig. 4
Fig. 4
FA intake and mitochondrial and peroxisomal β-oxidation pathway. (A) FA intake and β oxidation flow. (B) Relative abundance of FAs and TGs and multiblock PCA loading plots. The number following ‘TG’ and ‘FA’ indicates the total number of carbons in the esterified FAs, while the number after the colon ':' denotes the total number of double bonds. (C) mRNA levels of cluster of differentiation 36 (CD36), (D) mRNA levels of PPAR-α, (E) Protein levels of 3-ketoacyl-CoA thiolase mitochondria (3-KATM), (F) Protein levels of acetyl-CoA acyltransferase 2 (ACAA2), (G) Protein levels of carnitine O-palmitoyltransferase 1 (CPT1), (H) Protein levels of carnitine O-palmitoyltransferase 2 (CPT2), (I) Protein levels of acyl-CoA dehydrogenase (ACAD), (J) Protein levels of enoyl-CoA hydratase (ECH), (K) Protein levels of 3-hydroxy acyl-CoA dehydrogenase (HADH), (L) Protein levels of peroxisomal acyl-coenzyme A oxidase 1 (ACOX1), (M) Protein levels of peroxisomal bifunctional enzyme (PBE), (N) 3-ketoacyl-CoA thiolase peroxisome (3-KATP), (P) denotes protein expressions analyzed by proteomics, (R) denotes gene expressions analyzed by real-time PCR. The vertical axis of the graph represents relative expression levels. Significance levels are indicated as ** for p < 0.01 and * for p < 0.05.
Fig. 5
Fig. 5
AMP degradation and ROS generation. (A) Metabolism pathway of AMP degraded to uric acid. AK: adenylate kinase, ADP: adenosine diphosphate, AMP: adenosine monophosphate, ADO: adenosine, ADE: adenine, IMP: inosine monophosphate, INS: inosine, HPX: hypoxanthine, XAN: xanthine, XOR: xanthine oxidoreductase. (B) Relative abundance of metabolites and multiblock PCA loading plots: Black bars: ZDF rats, white bars: SD rats. Error bars indicate standard deviation of six samples. Loading plots in multiblock PCA illustrate the relative similarities in metabolite expression. (C) Protein levels of AK, (D) Protein levels of AMP deaminase 3 (AMPD), (E) Protein levels of adenosine deaminase (ADA), (F) mRNA levels of xanthine dehydrogenase (Xdh). The vertical axis of the graph represents relative expression levels. Significance levels are indicated as ** for p < 0.01 and * for p < 0.05.
Fig. 6
Fig. 6
Nicotinamide and spermine metabolism. (A) Nicotinamide and spermine metabolism pathway. NAD: nicotinamide adenine dinucleotide, NAM: nicotinamide, MNAM: N-methyl nicotinamide, NMN: nicotinamide mononucleotide, NR: nicotinamide riboside, PUT: putrescine, SPM: spermine, SPD: spermidine, SAM: S-adenosyl methionine, SAH: S-adenosyl homocysteine, MTA: 5'-methylthio adenosine. (B) Relative abundance of metabolites in nicotinamide metabolism pathway. Significance levels are indicated as ** for p < 0.01 and * for p < 0.05.

Similar articles

References

    1. Sarwar, N. et al. Diabetes mellitus, fasting blood glucose concentration, and risk of vascular disease: A collaborative meta-analysis of 102 prospective studies. Lancet (London, England)375, 2215–2222. 10.1016/s0140-6736(10)60484-9 (2010). - PMC - PubMed
    1. Nakamura, K. et al. Pathophysiology and treatment of diabetic cardiomyopathy and heart failure in patients with diabetes mellitus. Int. J. Mol. Sci.23, 3587. 10.3390/ijms23073587 (2022). - PMC - PubMed
    1. Montaigne, D. et al. Myocardial contractile dysfunction is associated with impaired mitochondrial function and dynamics in type 2 diabetic but not in obese patients. Circulation130, 554–564. 10.1161/circulationaha.113.008476 (2014). - PubMed
    1. Rosca, M. G. & Hoppel, C. L. Mitochondria in heart failure. Cardiovasc. Res.88, 40–50. 10.1093/cvr/cvq240 (2010). - PMC - PubMed
    1. Dabravolski, S. A. et al. The role of mitochondrial abnormalities in diabetic cardiomyopathy. Int. J. Mol. Sci.23, 7863. 10.3390/ijms23147863 (2022). - PMC - PubMed

MeSH terms

Substances

LinkOut - more resources