. 2025 Jul 1;15(1):22052.
doi: 10.1038/s41598-025-04156-4.

Unveiling how mitotic spindle orientation in 3D human colon organoids affects matrix displacements through a 4D study using DVC

Affiliations

Unveiling how mitotic spindle orientation in 3D human colon organoids affects matrix displacements through a 4D study using DVC

L Magne et al. Sci Rep. .

Abstract

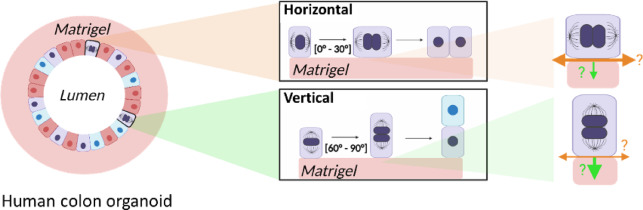
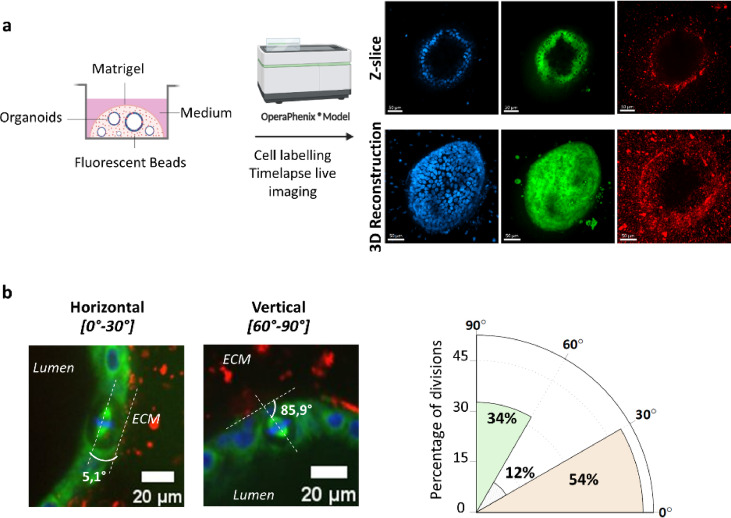
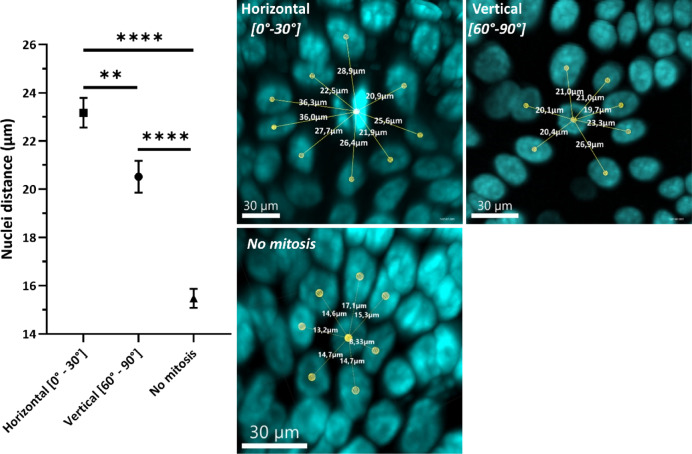
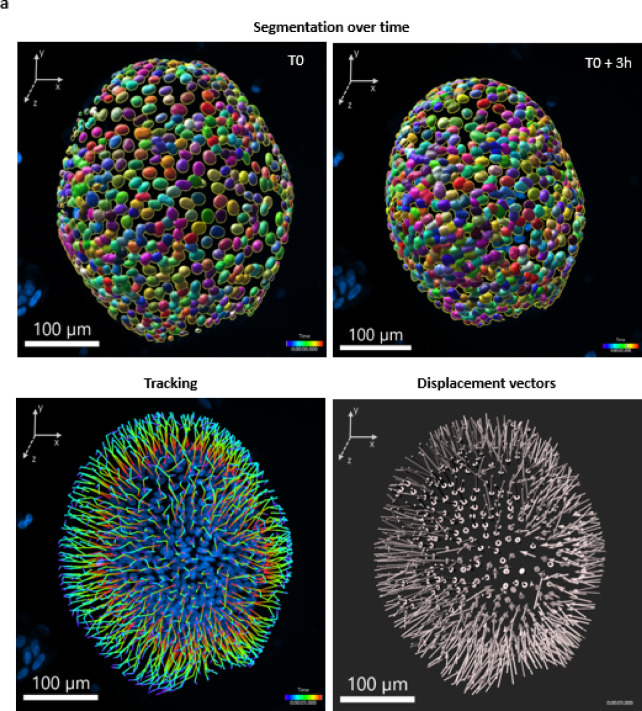
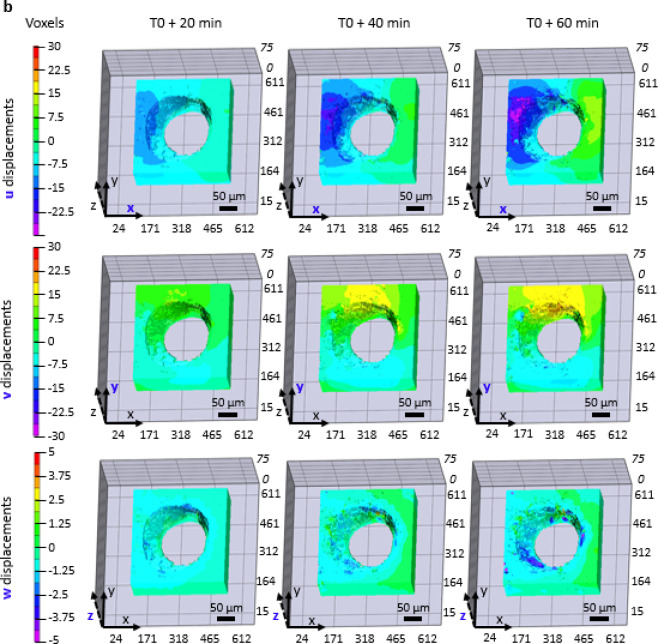
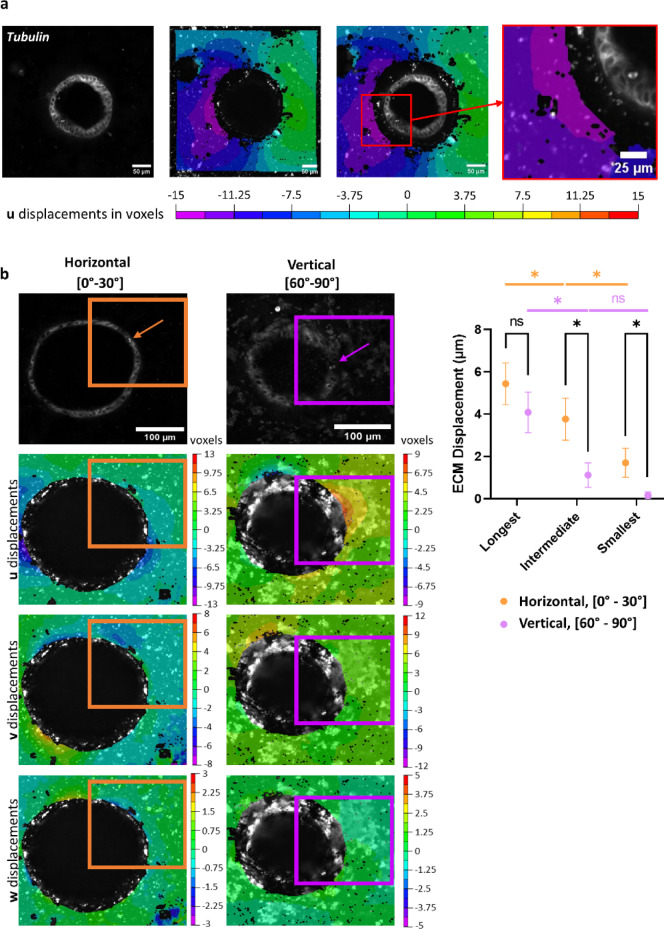
Cell division is a major event in tissue homeostasis, enabling renewal and regeneration. In human colon, vertical division is mainly observed in the stem cell compartment while horizontal division is more frequent in the progenitor transit amplifying zone. To study cell division, the human colon epithelium represents a relevant model due to its rapid renewal and high number of mitoses. Studying live mechanical interactions between the epithelium and its matrix in vivo is challenging due to the lack of suitable methods. Colon organoids seeded in Matrigel are good models because they recapitulate the organization and properties of tissue architecture. This culture set-up allows to study the displacements of the matrix around the organoid. We studied the impact of cell division within the human colonic epithelium on the extracellular matrix. We validated an original experimental and analytical process with 3D time-lapse confocal microscopy to follow cell division and matrix displacements, on which we performed a 4D Digital Volume Correlation. Depending on the orientation of the mitotic spindle, cell division affects the matrix differently. Vertical division causes a predominantly uniaxial displacement of the matrix, while horizontal division involves a multiaxial and wider displacement.

Keywords: 4D digital volume correlation; 4D displacements; Cell division; Extracellular matrix; Organoid.


Conflict of interest statement

Declarations. Competing interests: The authors declare no competing interests.

Figures

Fig. 1
Fig. 1
Cell divisions. Human colon organoids are used as a biological model to study the mechanical interactions between the epithelium and its extracellular matrix, particularly during cell divisions. A division can be horizontal (i.e., with a mitotic spindle positioned parallel to the matrix) or vertical (i.e., with a mitotic spindle positioned perpendicular to the matrix). Differentiated cells are represented in blue (secretory lineage) and red (absorptive lineage). Orange arrows represent orthoradial traction and green arrows represent radial traction. The width of the arrows corresponds to the hypothetical magnitude of traction. Illustration created in BioRender. HAMEL, D. (2025) https://BioRender.com/e03d823.
Fig. 2
Fig. 2
Validation of the biological model (a) Imaging process. Organoids are imaged with the Opera Phenix microscope (Perkin Elmer). The nuclei are labelled with Hoechst, laser 405 nm (blue), tubulin is labelled with Biotracker Tubulin, laser 488 nm (green) and the beads within the Matrigel are imaged with the 561 nm laser (red). (b) Left, representative images of horizontal and vertical divisions. Right, polar representation of the distribution of mitotic spindle orientations (n = 83 cells divisions of 30 organoids from 5 patients). Images generated with ImageJ/Fiji version 1.53 (https://imagej.net/ij/).
Fig. 3
Fig. 3
Measurements of distances between the dividing nucleus and surrounding nuclei. On the left, graph presenting the distances between the dividing nucleus in metaphase and the nuclei of neighboring cells for each type of division and for the controls (without division), (Mann-Whitney test, the measurements were carried out on 11 divisions of the two categories picked at random among the 45 vertical and 28 horizontal divisions and observed on 8 organoids from 3 patients (a minimum of 2 organoids/patient and a maximum of 3 organoids/patients were analysed), p-value = 0.0022 between the two types of division and p-value < 0.0001 between each of these groups and the control one, mean ± SEM). On the right, representative images for each type of division and a ‘control’ condition without cell division, with the distances represented. The distances measurement points are positioned at the barycentre of nuclei obtained by segmentation. A cell is considered as a neighboring cell if its membrane is adjacent to the membrane of the dividing cell, visualized with tubulin labeling. Images generated with ImageJ/Fiji version 1.53 (https://imagej.net/ij/).
Fig. 4
Fig. 4
Displacements of organoid nuclei over time obtained after segmentation and tracking. (a) Nuclei are segmented and tracked over time, respectively with CellPose 2.0 and Imaris 9.5. After the labeling and acquisition, nuclei are segmented with CellPose 2.0 at each time point for 3 h (Segmentation over time, visualisation of segmentation masks in Imaris viewer) and tracked over time with Imaris tracker (Tracking). The global displacement (Displacement vectors) illustrates the uniform movement of nuclei. All scales are on the relevant images. Images generated with Imaris 9.5. (b) Matrix displacement fields obtained by digital volume correlation. Matrix displacements at T0 + 20 min (left), T0 + 40 min (middle) and T0 + 60 min (right). The displacements of the voxels in each axis u, v and w are indicated: u in the first row, v in the second row, w in the third row. The color scale is in voxels. Voxel size is 0.64 × 0.64 × 2 μm. Images generated with VicVolume 1.0.10 (https://www.correlatedsolutions.com/volume).
Fig. 4
Fig. 4
Displacements of organoid nuclei over time obtained after segmentation and tracking. (a) Nuclei are segmented and tracked over time, respectively with CellPose 2.0 and Imaris 9.5. After the labeling and acquisition, nuclei are segmented with CellPose 2.0 at each time point for 3 h (Segmentation over time, visualisation of segmentation masks in Imaris viewer) and tracked over time with Imaris tracker (Tracking). The global displacement (Displacement vectors) illustrates the uniform movement of nuclei. All scales are on the relevant images. Images generated with Imaris 9.5. (b) Matrix displacement fields obtained by digital volume correlation. Matrix displacements at T0 + 20 min (left), T0 + 40 min (middle) and T0 + 60 min (right). The displacements of the voxels in each axis u, v and w are indicated: u in the first row, v in the second row, w in the third row. The color scale is in voxels. Voxel size is 0.64 × 0.64 × 2 μm. Images generated with VicVolume 1.0.10 (https://www.correlatedsolutions.com/volume).
Fig. 5
Fig. 5
Impact of mitotic spindle orientation on ECM. (a) Z -axis section of an organoid containing mitosis. From left to right: tubulin, displacements of the ECM along the u axis in the same section plane, merge of tubulin channel and matrix displacements, zoom in on the area where cell division takes place. All scales are on the images. (b) ECM displacements due to horizontal or vertical division. On the upper panel, tubulin labelling showing the mitotic spindle. Arrows indicate the mitotic spindle. On the bottom panel, representation of matrix displacements on the z-slice of mitosis, calculated in 3D, in the three axes. Orange and magenta squares represent areas impacted by division. On the right, representation of the longest, intermediate and smallest displacements of the ECM for each type of cell division. Representation of the mean ± SEM (t test, 8 measurements in each group, p-value = 0.045 between the two smallest displacements, p-value = 0.037 between the intermediate displacements and p-value = 0.034 between the longest displacements. t test between longest and intermediate displacement in vertical divisions: p-value = 0.0146; and in horizontal: p-value = 0.0152. t test between intermediate and smallest displacement in vertical divisions: p-value = 0.1109; and in horizontal divisions: p-value = 0.0474). Images generated with VicVolume 1.0.10 (https://www.correlatedsolutions.com/volume).

Similar articles

References

    1. Gupta, V. K. et al. The nature of cell division forces in epithelial monolayers. J. Cell Biol.220, e202011106 (2021). - PMC - PubMed
    1. Barker, N. et al. Identification of stem cells in small intestine and colon by marker gene Lgr5. Nature449, 1003–1007 (2007). - PubMed
    1. Medema, J. P. & Vermeulen, L. Microenvironmental regulation of stem cells in intestinal homeostasis and cancer. Nature474, 318–326 (2011). - PubMed
    1. Onfroy-Roy, L., Hamel, D., Foncy, J., Malaquin, L. & Ferrand, A. Extracellular matrix mechanical properties and regulation of the intestinal stem cells: when mechanics control fate. Cells9, 2629 (2020). - PMC - PubMed
    1. Lu, P., Takai, K., Weaver, V. M. & Werb, Z. Extracellular matrix degradation and remodeling in development and disease. Cold Spring Harb Perspect. Biol.3, a005058 (2011). - PMC - PubMed

LinkOut - more resources