. 2025 Jul 1;15(1):21721.
doi: 10.1038/s41598-025-05994-y.

THSG counteracts microglial glycolytic reprogramming and neuronal necroptosis both in vivo and in vitro under conditions of neuroinflammation

Affiliations

THSG counteracts microglial glycolytic reprogramming and neuronal necroptosis both in vivo and in vitro under conditions of neuroinflammation

Zhe Guo et al. Sci Rep. .

Abstract

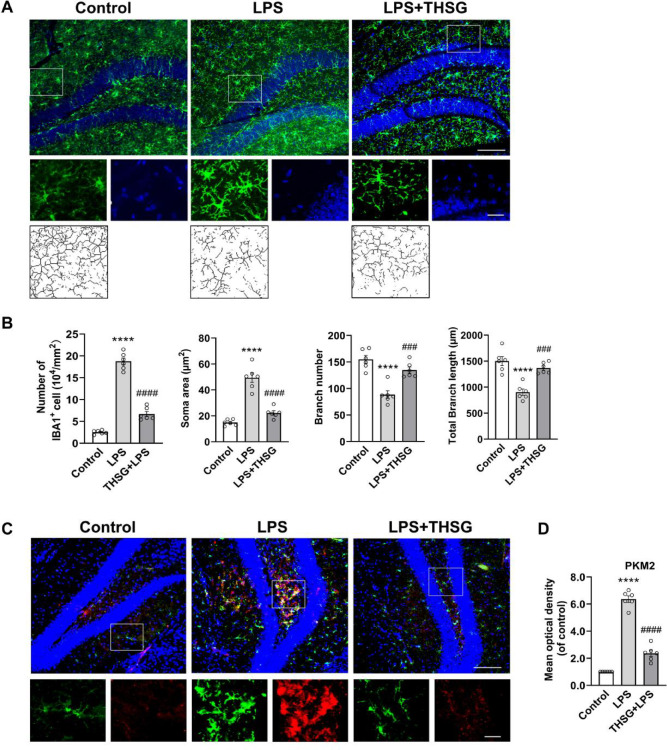
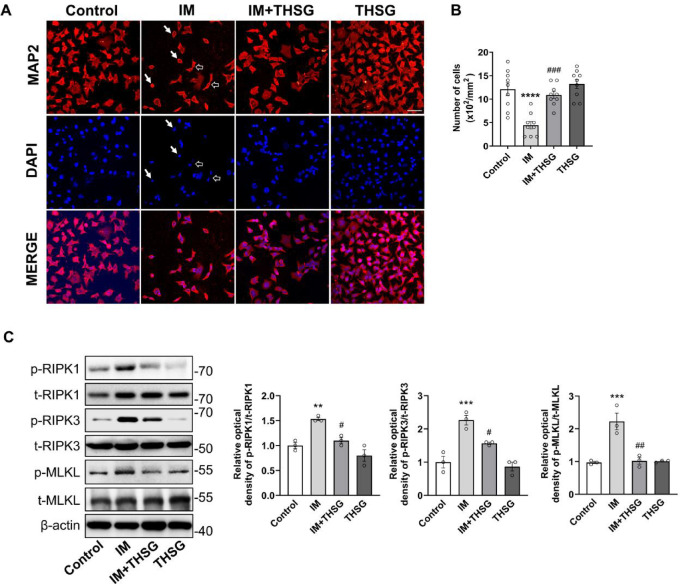
Microglial activation, driven by a metabolic shift towards aerobic glycolysis, is implicated in neuroinflammation and neurological disorders like depression. THSG (2,3,5,4'-Tetrahydroxystilbene-2-O-β-D-glucoside), derived from Polygonum multiflorum, exhibits anti-inflammatory and neuroprotective properties, but its mechanisms, particularly its impact on microglial metabolism, are largely unexplored. Using a LPS-induced mouse model of neuroinflammation, we observed that THSG significantly ameliorated depression-like behaviors. It suppressed pro-inflammatory cytokine production (TNF-α, IL-1β, IL-6, iNOS), inhibited microglial activation, and reduced key necroptosis markers (phosphorylated RIPK1, RIPK3, and MLKL) in the hippocampus. Importantly, THSG effectively suppressed LPS-induced activation of the glycolytic pathway in the hippocampus, as evidenced by increased ATP levels, decreased lactate levels, reduced activity of key glycolytic enzymes, and decreased expression of PKM2 and HIF-1α, critical players in microglial glycolysis. Further in vitro studies with BV2 microglial cells confirmed that THSG significantly suppressed glycolytic enhancement, promoting a metabolic shift towards oxidative phosphorylation, thus inhibiting inflammatory activation of microglia. Co-culture experiments of BV2 cells and SH-SY5Y cells further corroborated the in vivo findings, demonstrating that THSG mitigated inflammation-induced necroptosis in SH-SY5Y neurons by reducing phosphorylation of RIPK1, RIPK3, and MLKL, thus protecting neurons from damage. Our results highlight the potential of THSG as a therapeutic agent for neuroinflammatory disorders by modulating microglial metabolic reprogramming and inhibiting neuronal necroptosis.

Keywords: Depression; Metabolic reprogramming; Microglia; Necroptosis; Neuroinflammation; THSG.


Conflict of interest statement

Declarations. Competing interests: The authors declare no competing interests.

Figures

Fig. 1
Fig. 1
THSG mitigates LPS-induced inflammatory depression-like behaviors and neuronal necroptosis in mice. (A) Timeline of drug administration and behavioral testing. (B) Representative trajectories of mouse movement in the Open Field Test (OFT). (C) Quantitative analysis of behavioral tests, including OFT, Forced Swim Test (FST), Tail Suspension Test (TST), and Sucrose Preference Test (SPT), across four groups. OFT: Total distance traveled, n = 8 per group; Time spent in the center, n = 8 per group; FST, n = 7 per group; TST, n = 6 per group; SPT, n = 4 per group. (D) Quantitative analysis of TNF-α, IL-1β, IL-6, and iNOS mRNA expression levels in hippocampal tissue across four groups (n = 5 per group). (E) Representative immunoblots and quantitative analysis of phosphorylated RIPK1 (p-RIPK1), RIPK3 (p-RIPK3), and MLKL (p-MLKL) protein levels in the mouse hippocampus across four groups (n = 3 per group), normalized to total RIPK1 (t-RIPK1) for p-RIPK1, total RIPK3 (t-RIPK3) for p-RIPK3, and total MLKL (t-MLKL) for p-MLKL. The original images of blots are in the Supplementary Information. All data are presented as mean ± SEM. Statistical significance: * indicates Control vs. LPS; # indicates LPS vs. LPS + THSG ; **(##) p < 0.01; ***(###) p < 0.001; ****(####) p < 0.0001; one-way ANOVA followed by Tukey’s post hoc test.
Fig. 2
Fig. 2
THSG attenuates LPS-induced glycolytic enhancement in the mouse hippocampus. (A) Quantitative analysis of ATP and lactate levels in hippocampal tissue across four groups (n = 5 per group). (B) Quantitative analysis of PK, HK, and PDH enzyme activities in hippocampal tissue across four groups, normalized to the control group (n = 5 per group). (C) Quantitative analysis of mRNA expression levels of Glut1, Pkm2, and Hif1α in hippocampal tissue across four groups (n = 5 per group). (D) Representative immunoblots and quantitative analysis of PKM2, HIF-1α, and IBA1 protein levels in hippocampal tissue across four groups (n = 3 per group), normalized to β-actin. The original images of blots are in the Supplementary Information. All data are presented as mean ± SEM. * indicates Control vs. LPS; # indicates LPS vs. LPS + THSG; *(#) p < 0.05; **(##) p < 0.01; ***(###) p < 0.001; ****(####) p < 0.0001. Statistical analysis: One-way ANOVA followed by Tukey’s post hoc test (A, C, D); one-sample t-test (B, Control vs. LPS); unpaired t-test (B, LPS vs. LPS + THSG).
Fig. 3
Fig. 3
THSG inhibits LPS-induced microglial activation in the mouse hippocampus. (A) Representative immunofluorescence images show IBA1 (green) and DAPI (blue) staining in the dentate gyrus of the mouse hippocampus (scale bar: 100 μm). Enlarged views of boxed areas are shown below (scale bar: 10 μm). The schematic diagram at the bottom illustrates the analysis of the microglial cytoskeleton. (B) Quantitative analysis of IBA1-positive cells in the dentate gyrus, including cell number, soma area, branch number and total branch length (n = 6 per group). Statistical analysis: One-way ANOVA followed by Tukey’s post hoc test. (C) Representative immunofluorescence images depict PKM2 (red), IBA1 (green), and DAPI (blue) staining in the dentate gyrus (scale bar: 100 μm). Enlarged views of boxed areas are shown below (scale bar: 10 μm). (D) Quantitative analysis of PKM2 fluorescence intensity in the dentate gyrus, normalized to the control group (n = 6 per group). Statistical analysis: One-sample t-test (Control vs. LPS); unpaired t-test (LPS vs. LPS + THSG). Data are presented as mean ± SEM. * indicates Control vs. LPS; # indicates LPS vs. LPS + THSG; **(##) p < 0.01; ***(###) p < 0.001; ****(####) p < 0.0001.
Fig. 4
Fig. 4
THSG inhibits LPS-induced microglial activation and pro-inflammatory cytokine expression in BV2 Cells. (A) Immunofluorescence images showing BV2 cells cultured under normal conditions (Control), or treated with LPS, THSG, or LPS and THSG (LPS + THSG) for 24 h. Cells were stained with IBA1 (green) and DAPI (blue) (scale bar: 25 μm). Arrows indicate activated cells, characterized by elongated, spindle-shaped processes and binucleation. (B) Schematic representation of LPS stimulation in BV2 cells. (C) Quantitative analysis of the percentage of activated BV2 cells under four treatment conditions (n = 8 per group). (D) Quantitative analysis of TNF-α, IL-1β, IL-6, and iNOS mRNA expression levels in BV2 cells under four treatment conditions (n = 5 per group). Data are presented as mean ± SEM. * indicates Control vs. LPS; # indicates LPS vs. LPS + THSG; ***(###) p < 0.001; ****(####) p < 0.0001. Statistical analysis: One-way ANOVA followed by Tukey’s post hoc test.
Fig. 5
Fig. 5
THSG reprograms energy metabolism in LPS-stimulated BV2 Cells. (AB) Quantitative analysis of ATP and lactate levels (A) and HK and PK enzyme activity (B, normalized to the control group) in BV2 cells cultured under normal conditions (Control), or treated with LPS, THSG, or LPS and THSG (LPS + THSG) for 24 h (n = 5 per group). (C) Seahorse real-time extracellular acidification rate (ECAR) and oxygen consumption rate (OCR) measurements in BV2 cells cultured under normal conditions (Control), or treated with LPS, THSG, IL4, LPS and THSG (LPS + THSG), or IL4 and THSG (IL4 + THSG) for 24 h. (D) Quantitative analysis of glycolysis and basal oxygen consumption in BV2 cells under the respective treatment conditions shown in (C) (n = 6 per group). (E) Quantitative analysis of mRNA levels for Glut1, Hk2, Ldha, G6pdx, Pkm2 and Hif1α in BV2 cells under four treatment conditions (same as A) (n = 5 per group). (F) Representative immunoblots and quantitative analysis of PKM2 and HIF-1α protein levels in BV2 cells under four treatment conditions (same as A) (n = 3 per group), normalized to β-actin. The original images of blots are in the Supplementary Information. Data are presented as mean ± SEM. * indicates Control vs. LPS; # indicates LPS vs. LPS + THSG; **(##) p < 0.01; ***(###) p < 0.001; ****(####) p < 0.0001; ns indicates not significant in IL4 vs. IL4 + THSG. Statistical analysis: One-way ANOVA followed by Tukey’s post hoc test (A, C, D, E, F); one-sample t-test (B, Control vs. LPS); unpaired t-test (B, LPS vs. LPS + THSG).
Fig. 6
Fig. 6
THSG protects SH-SY5Y neurons from LPS-induced damage in a co-culture system. (A) A schematic representation depicts the co-culture system. Conditioned medium, collected from BV2 cells cultured under normal conditions or treated with LPS (inflammatory medium), was added to SH-SY5Y cultures. The SH-SY5Y cultures were previously treated with or without THSG to establish the co-culture model. Control: no LPS, no THSG; LPS: no THSG; LPS + THSG: LPS and THSG; THSG: no LPS. (B) Quantitative analysis of SH-SY5Y cell viability in the co-culture system under different LPS concentrations (n = 5 per group). (C) THSG significantly attenuates LPS-induced neuronal damage in a co-culture system (n = 5 per group). Data are presented as mean ± SEM. * indicates Control vs. LPS; # indicates LPS vs. LPS + THSG; *(#) p < 0.05; **(##) p < 0.01; ****(####) p < 0.0001. Statistical analysis: One-way ANOVA followed by Tukey’s post hoc test.
Fig. 7
Fig. 7
THSG prevents inflammation-mediated neuronal necroptosis. (A) Representative immunofluorescence images show SH-SY5Y cell morphology in co-culture systems under normal conditions, or treated with IM (inflammatory medium), THSG, or IM and THSG (IM + THSG). Cells were stained with microtubule-associated protein 2 (MAP2, red) and DAPI (blue). Arrows indicate apoptotic (solid arrows) or shrunken (hollow arrows) cells (Scale bar: 50 μm). (B) Quantitative analysis of the number of SH-SY5Y cells in the co-culture system under four conditions (n = 9 per group). (C) Representative immunoblots and quantitative analysis of phosphorylated RIPK1 (p-RIPK1), RIPK3 (p-RIPK3), and MLKL (p-MLKL) protein levels in SH-SY5Y cells in co-culture systems under four conditions (n = 3 per group), normalized to total RIPK1 (t-RIPK1) for p-RIPK1, total RIPK3 (t-RIPK3) for p-RIPK3, and total MLKL (t-MLKL) for p-MLKL. The original images of blots are in the Supplementary Information. Data are presented as mean ± SEM. * indicates Control vs. LPS; # indicates LPS vs. LPS + THSG; *(#) p < 0.05; **(##) p < 0.01; ***(###) p < 0.001; ****(####) p < 0.0001. Statistical analysis: One-way ANOVA followed by Tukey’s post hoc test.

Similar articles

References

    1. Heneka, M. T., Kummer, M. P. & Latz, E. Innate immune activation in neurodegenerative disease. Nat. Rev. Immunol.14, 463–477. 10.1038/nri3705 (2014). - PubMed
    1. Najjar, S., Pearlman, D. M., Alper, K., Najjar, A. & Devinsky, O. Neuroinflammation and psychiatric illness. J. Neuroinflamm.10, 43. 10.1186/1742-2094-10-43 (2013). - PMC - PubMed
    1. Ransohoff, R. M. & Brown, M. A. Innate immunity in the central nervous system. J. Clin. Invest.122, 1164–1171. 10.1172/JCI58644 (2012). - PMC - PubMed
    1. Chen, Z. & Trapp, B. D. Microglia and neuroprotection. J. Neurochem136(Suppl 1), 10–17. 10.1111/jnc.13062 (2016). - PubMed
    1. Qin, L. et al. Systemic LPS causes chronic neuroinflammation and progressive neurodegeneration. Glia55, 453–462. 10.1002/glia.20467 (2007). - PMC - PubMed

MeSH terms

LinkOut - more resources