. 2025 Jul 1;15(1):22033.
doi: 10.1038/s41598-025-05643-4.

Codon-deoptimized single-round infectious virus for therapeutic and vaccine applications

Affiliations

Codon-deoptimized single-round infectious virus for therapeutic and vaccine applications

Takafumi Noguchi et al. Sci Rep. .

Abstract

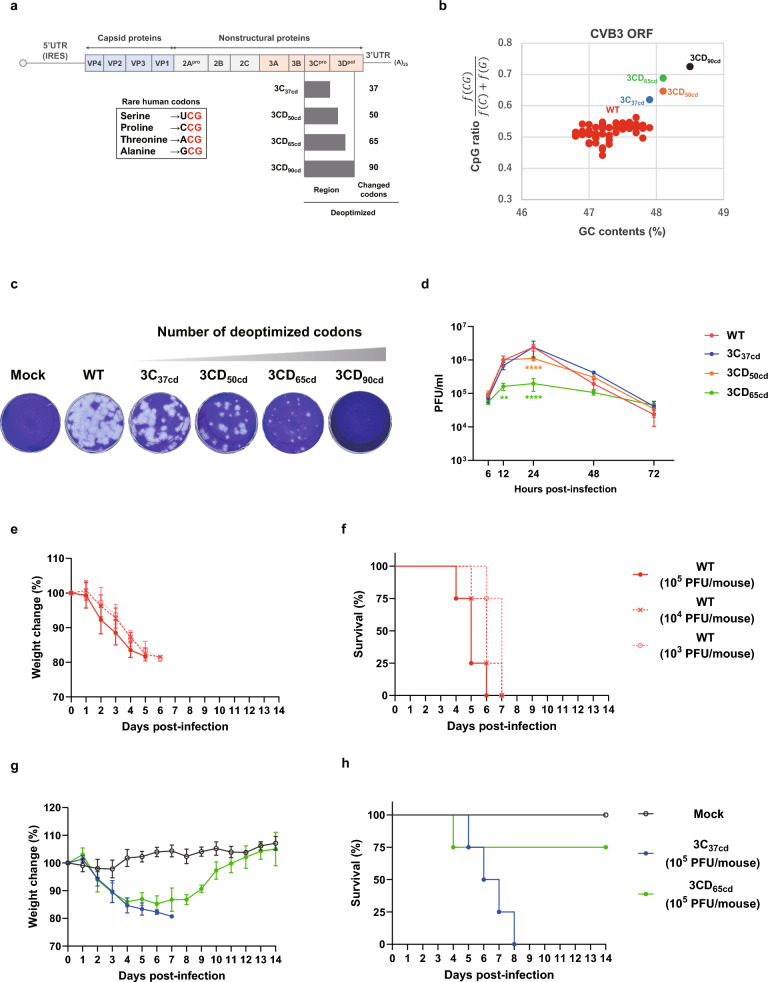
Coxsackievirus B3 (CVB3) is a major cause of myocarditis and acute pancreatitis, particularly in neonates, in whom infections result in severe symptoms and high mortality rates. Despite the urgent need for effective preventive strategies, no vaccines or therapeutic agents have been developed. Live-attenuated vaccines hold promise for combating viral infections; however, their pathogenicity must be carefully regulated without compromising immunogenicity. Here, we investigated codon deoptimization and defective viral genomes (DVGs) as strategies to modulate CVB3 pathogenicity, while preserving its immune-activating capacity. Codon-deoptimized CVB3s with increased CpG dinucleotide content in their 3CD region were engineered, leveraging the innate immunostimulatory properties of CpG. These modified CVB3s exhibited attenuated pathogenicity proportional to the level of codon deoptimization and induced protective immunity against wild-type CVB3 (CVB3WT), making them viable live-attenuated vaccine candidates. Additionally, DVGs derived from codon-deoptimized CVB3 demonstrated superior viral interference and enhanced stimulation of neutralizing antibody production compared to DVGs derived from CVB3WT. These findings highlight that CpG-enriched genomes and DVGs are promising tools for regulating viral pathogenicity, enhancing vaccine safety, and developing therapeutic strategies against viral infections.

Keywords: Codon deoptimization; Coxsackievirus B3; CpG dinucleotide; Defective viral genomes; Live-attenuated vaccines.


Conflict of interest statement

Declarations. Competing interests: T.N., T.S., P.M., and H.E. are employees of BIKEN, with H.E. holding a managerial position. A.M. declares no competing interests. Appropriate measures were taken to ensure that these affiliations did not influence the study’s design, data collection, analysis, or interpretation. Ethics approval: All experiments were carried out in accordance with relevant guidelines and regulations. This study is reported in accordance with ARRIVE guidelines.

Figures

Fig. 1
Fig. 1
Codon deoptimization of the 3CD region of CVB3 resulted in reduced viral replication in correlation with the number of deoptimized codons (a) Schematic representations of codon-deoptimized Coxsackievirus B3 (CVB3) genomes. The gray bars represent the deoptimized regions. (b) The CpG ratio and the GC content in the polyprotein open reading frame sequence of wild-type (WT) or codon-deoptimized CVB3 genomes were analyzed using SSE V1.4. WT sequences were obtained from the National Center for Biotechnology Information website. (c) Plaque morphologies of WT and codon-deoptimized CVB3s in Vero cells at 3 days post-infection. (d) Comparison of the growth kinetics of the WT and codon-deoptimized CVB3s. Vero cells were infected with each virus at a multiplicity of infection of 0.02, and the viral titers at the indicated time points were evaluated in Vero cells using a plaque assay (n = 3). Red, blue, orange and green lines represent WT, 3C37cd, 3CD50cd, and 3CD65cd, respectively. (e-h) Mice were infected with three different doses (103, 104 or 105 plaque-forming units [PFU]) of WT virus or 105 PFU of codon- deoptimized viruses (3C37cd, 3CD65cd) via the intraperitoneal (i.p.) route. Body weight change (e, g) and survival (f, h) were monitored daily for 2 weeks (n = 4). The solid red line with filled circles, the dashed dark pink line with crosses, and the dashed light pink line with open circles represent different doses of WT virus: 103, 104, and 105 PFU, respectively. The solid gray line with open circles, the solid blue line with filled circles, and the solid green line with filled circles represent the mock control, 105 PFU of 3C37cd, and 105 PFU of 3CD65cd, respectively. All data are presented as the mean ± standard deviation (SD). Two-way analysis of variance (ANOVA) with Sidak’s multiple comparisons test was used for statistical analysis of viral growth. Survival rates were compared using the log-rank test. **P < 0.01, ****P < 0.0001.
Fig. 2
Fig. 2
A single-dose infection with 3CD65cd via the intramuscular route induced protective immunity in mice. (a, b) Mice were infected with 103 PFU of WT or 3CD65cd via the intranasal (i.n.) or the intramuscular (i.m.) route. Body weight changes (a) and survival (b) were monitored daily for 2 weeks (n = 5). Solid lines with filled circles and open triangles represent i.n. and i.m. infection, respectively (red: WT; green: 3CD65cd). Asterisks in the weight change graph indicate a statistical comparison between the mock and 3CD65cd (i.n.) groups with corresponding P-values. (c) Experimental design of the challenge study. Mice were infected with two different doses (102 PFU or 103 PFU) of WT or 3CD65cd virus via the i.m. route. (d) Body weight changes were monitored daily for 2 weeks (n = 5). (e) Neutralization titers of sera from mice infected with CVB3WT or 3CD65cd. Sera were collected 3 weeks after infection. (f) Mice were challenged with 104 PFU of CVB3WT and body weight changes were monitored daily for 2 weeks (n = 4 or 5). Solid red and green lines represent WT and 3CD65cd, respectively. Red and green indicate 103 PFU, while pink and light green indicate 102 PFU. Lines in the neutralization assay graph represent the median, while all other data are presented as the mean ± SD. Two-way ANOVA with Sidak’s multiple comparisons test was performed for statistical analysis of body weight changes or neutralizing antibody titers. *P < 0.05, **P < 0.01, ***P < 0.001, ****P < 0.0001.
Fig. 3
Fig. 3
Simultaneous infection of CVB3s with DVPs via the intramuscular route reduced the pathogenicity of CVB3 without compromising immunogenicity in mice. (a) Schematic representation of WT- or 3CD65cd-based defective viral genomes (DVGWT and DVG65cd, respectively). The gray box indicates the deoptimized region. (b) HeLa cells were infected with defective viral particles (DVPs) containing DVGWT or DVG65cd. Establishment of infection with the DVPs was confirmed based on green fluorescent protein (GFP) expression and double-stranded (ds) RNA production. Green, red, and blue indicate GFP, dsRNA, and DNA, respectively. Scale bar = 50 µm. (c) Experimental design for co-infections. Mice were infected with WT or 3CD65cd (103 PFU/mouse) together with DVPWT or DVP65cd (2 × 104 IU/mouse) via the i.m. route. Body weight change and survival were monitored daily for 2 weeks. Sera were collected 3 weeks post-infection, and the induction of neutralizing antibodies was evaluated (n = 8). The results are shown separately for the WT (df) and 3CD65cd (gi) viruses. In panels d, e, g, and h, different line and marker styles indicate experimental groups. Solid red lines with filled red circles represent the WT virus only. Solid pink lines with open light red circles and light green open circles represent WT with DVPWT and WT with DVP65cd, respectively. Solid green lines with filled green circles represent the 3CD65cd virus only. Solid light green lines with open pink circles and open light green circles represent 3CD65cd with DVPWT and 3CD65cd with DVP65cd, respectively. In panels f and i, filled red and green circles represent WT and 3CD65cd alone, respectively. Filled pink and filled light green circles indicate WT and 3CD65cd co-infected with DVPWT, respectively, while open pink and open light green circles represent co-infection with DVP65cd in WT and 3CD65cd groups, respectively. Lines in the neutralization assay graph represent the median, while all other data are presented as the mean ± SD. For statistical analysis of weight changes and neutralizing antibody titers, two-way ANOVA with Sidak’s multiple comparisons test was performed. For the comparison of survival rates, the log-rank test was performed. *P < 0.05, **P < 0.01, ***P < 0.001, ****P < 0.0001.

Similar articles

References

    1. Garmaroudi, F. S. et al. Coxsackievirus B3 replication and pathogenesis. Futur. Microbiol.10, 629–653. 10.2217/fmb.15.5 (2015). - PubMed
    1. Carre, A., Vecchio, F., Flodstrom-Tullberg, M., You, S. & Mallone, R. Coxsackievirus and type 1 diabetes: Diabetogenic mechanisms and implications for prevention. Endocr. Rev.44, 737–751. 10.1210/endrev/bnad007 (2023). - PubMed
    1. Zhang, M. et al. Clinical characteristics of severe neonatal enterovirus infection: A systematic review. BMC Pediatr.21, 127. 10.1186/s12887-021-02599-y (2021). - PMC - PubMed
    1. Deng, H. et al. An intranasal attenuated coxsackievirus B3 vaccine induces strong systemic and mucosal immunity against CVB3 lethal challenge. J. Med. Virol.96, e29831. 10.1002/jmv.29831 (2024). - PubMed
    1. Lasrado, N. et al. Attenuated strain of CVB3 with a mutation in the CAR-interacting region protects against both myocarditis and pancreatitis. Sci. Rep.11, 12432. 10.1038/s41598-021-90434-w (2021). - PMC - PubMed

MeSH terms

LinkOut - more resources