. 2025 Jul 2;15(1):22833.
doi: 10.1038/s41598-025-06152-0.

Genomic architecture of purebred and crossbred Moghani lambs with Texel and Booroola sheep

Affiliations

Genomic architecture of purebred and crossbred Moghani lambs with Texel and Booroola sheep

Reza Talebi et al. Sci Rep. .

Abstract

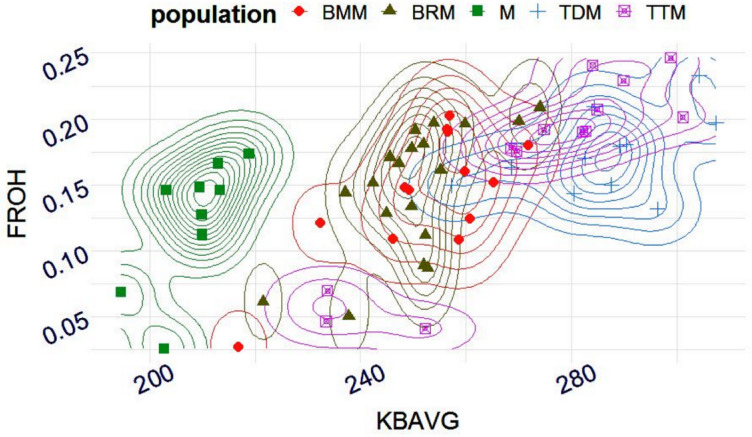
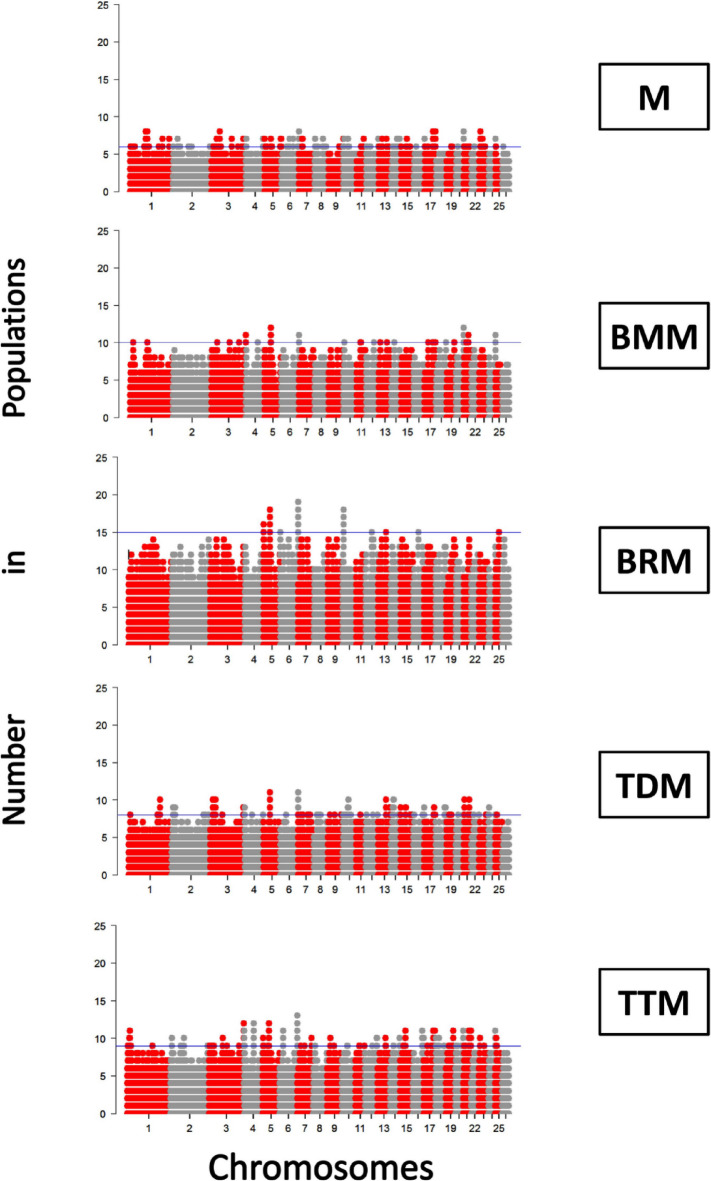
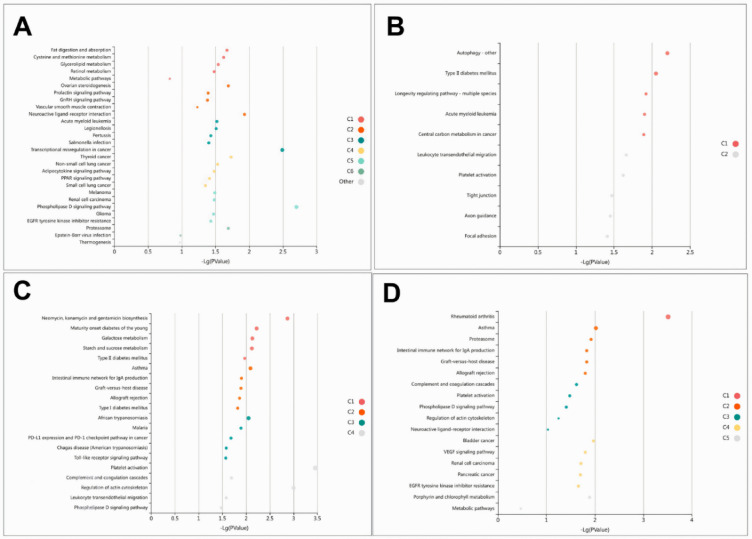
Crossbreeding with Booroola or Texel sheep harboring major genes for prolificacy and muscularity enhances productivity but it may limit adaptation and survivorship in crossbred lambs. Thus, the trade-offs that impact productivity and adaptability have not been quantified or modeled and remain largely elusive at the genetic level, limiting the development of optimized breeding strategies. This study investigates the genomic architecture of purebred Moghani sheep and the first paternal backcross (PBC1) generation of crossbred lambs, including Booroola Merino × Moghani (BMM), Booroola Romney × Moghani (BRM), Texel Dalzell × Moghani (TDM), and Texel Tamlet × Moghani (TTM). Genotyping-by-sequencing (GBS) was used to assess genetic diversity, admixture patterns, and selection signatures. Structure analysis revealed complex admixture in BMM and BRM, while TDM and TTM were more homogeneous. Purebred Moghani sheep exhibited the highest genetic diversity (HO = 0.521 ± 0.10) and the lowest inbreeding (FIS = - 0.474), serving as a key genetic bridge among the groups. In contrast, BRM and TTM showed lower heterozygosity (HO = 0.410 ± 0.09 and 0.431 ± 0.10) and increased inbreeding (FROH), with extended runs of homozygosity (ROH), suggesting recent inbreeding and reduced effective population sizes. The functional annotation of ROH islands connected TDM and TTM to immune response and muscle development pathways like VEGF and insulin signaling, while BMM and BRM were linked to metabolic and reproductive pathways like central carbon metabolism in cancer (mTOR) and prolactin signaling (LHB). Taken together, these results highlight the need for improved breeding methods that prioritize trade-offs associated with reduced genetic diversity in crossbred populations. Nevertheless, given the limited genotype representation, the results should be taken with caution; so, next research should cover a larger panel of genotypes in order to have a more complete knowledge.

Keywords: Genetic diversity; Genomic architecture; Genotyping-by-sequencing; Inbreeding; Sheep.


Conflict of interest statement

Declarations. Competing interests: The authors declare no competing interests.

Figures

Fig. 1
Fig. 1
Crossbreeding of five sheep breeds/strains. Texel sire strains (Texel Dalzell [TD] and Texel Tamlet [TT]) and Booroola sire strains (Booroola Merino [BM] and Booroola Romney [BR]) were initially crossed with Moghani pure ewes (M), producing F1 crossbred rams. These F1 rams were then backcrossed with purebred Moghani ewes, resulting in the paternal backcross generation (PBC1): Booroola Merino × Moghani (BMM), Booroola Romney × Moghani (BRM), Texel Dalzell × Moghani (TDM), and Texel Tamlet × Moghani (TTM).
Fig. 2
Fig. 2
Genotyping-by-sequencing (GBS) data summary. (A) Total raw reads generated and the percentage mapped across 65 samples. (B) Average mapping quality across 65 samples. (C) Average GBS coverage across 65 samples.
Fig. 3
Fig. 3
Distribution of variants on sheep chromosomes. (A) SNP density across each sheep chromosome, displayed with SNP counts in 1 Mb window sizes. (B) Proportion of variant consequences across autosomes, with a majority being intronic (62%) and missense (60%).
Fig. 4.
Fig. 4.
3D PCA plot of genomic variation across five sheep populations. The plot visualizes the first three principal components (PC1, PC2, and PC3) capturing 35%, 25%, and 20% of the variation, respectively. Moghani pure sheep (M), Texel Dalzell × Moghani (TDM), Texel Tamlet × Moghani (TTM), Booroola Romney × Moghani (BRM), Booroola Merino × Moghani (BMM).
Fig. 5
Fig. 5
Genetic ancestry inference and model selection. (A) Cross-validation (CV) error as a function of the number of clusters (K). The CV error decreases initially, reaching a minimum at K = 4 (CV = 0.44), before increasing at higher values. Blue circles represent data points, and the red line connects them to highlight the trend. (B) Genetic ancestry analysis of five populations (BMM, BRM, M, TDM, and TTM) for different assumed ancestral populations (K = 2 to K = 4). Each vertical bar represents an individual, with colors indicating estimated ancestry proportions.
Fig. 6
Fig. 6
A schematic representation of ROH profile in sheep genome. The profile is given by the average genomic inbreeding coefficient (FROH) and the average ROH lengths based on Kb (KBAVG).
Fig. 7
Fig. 7
Inbreeding within sheep populations. The Pearson correlation is presented between two measures of molecular inbreeding metrics. Populations are coded as M = Moghani pure sheep, BMM = Booroola Merino × Moghani, BRM = Booroola Romney × Moghani, TDM = Texel Dalzell × Moghani, TTM = Texel Tamlet × Moghani.
Fig. 8
Fig. 8
Genome wide distribution of runs of homozygosity (ROH) hotspots. The x-axis represents the SNP genomic coordinate chromosome-wise, and the y-axis shows the proportion of overlapping ROH shared among individuals based upon number in population. Populations are coded as M = Moghani pure sheep, BMM = Booroola Merino × Moghani, BRM = Booroola Romney × Moghani, TDM = Texel Dalzell × Moghani, TTM = Texel Tamlet × Moghani.
Fig. 9
Fig. 9
Venn diagrams illustrating the overlap and uniqueness of variants and genes within ROH islands across five sheep populations (M, BMM, BRM, TDM, and TTM). (A) Venn diagram showing shared and unique variants within ROH islands among the populations. (B) Venn diagram highlighting shared and unique genes within ROH islands across the populations.
Fig. 10
Fig. 10
KOBAS-enriched pathways associated with genes in ROH islands across four crossbred lamb populations. (A) BMM: Pathways related to reproductive traits and metabolic adaptability. (B) BRM: Pathways linked to overall health maintenance. (C) TDM: Pathways supporting muscle development and energy utilization. (D) TTM: Pathways involved in muscle growth and immune response.

Similar articles

References

    1. Alberto, F. J. et al. Convergent genomic signatures of domestication in sheep and goats. Nat. Commun.9, 813 (2018). - PMC - PubMed
    1. World Livestock 2011—Livestock in food security. http://www.fao.org/3/i2373e/i2373e00.htm.
    1. Talebi, R. et al. Detection of single nucleotide polymorphisms at major prolificacy genes in the Mehraban sheep and association with litter size. Ann. Anim. Sci.18, 685 (2018).
    1. Talebi, R. et al. Association of ovine follistatin gene polymorphisms with body measurements, fat-tail traits and morphometric of head in Iranian Mehraban sheep. Small Rumin. Res.225, 107020 (2023).
    1. Majd, S. A. et al. Polymorphism identification in ovine KISS1R/GPR54 gene among pure and crossbreeds of Iranian sheep. Small Rumin. Res.173, 23–29 (2019).

LinkOut - more resources