. 2025 Jul 2;15(1):22514.
doi: 10.1038/s41598-025-05277-6.

A single-cell atlas of the murine limb skeleton integrating the developmental and adult stages

Affiliations

A single-cell atlas of the murine limb skeleton integrating the developmental and adult stages

Tim Herpelinck et al. Sci Rep. .

Abstract

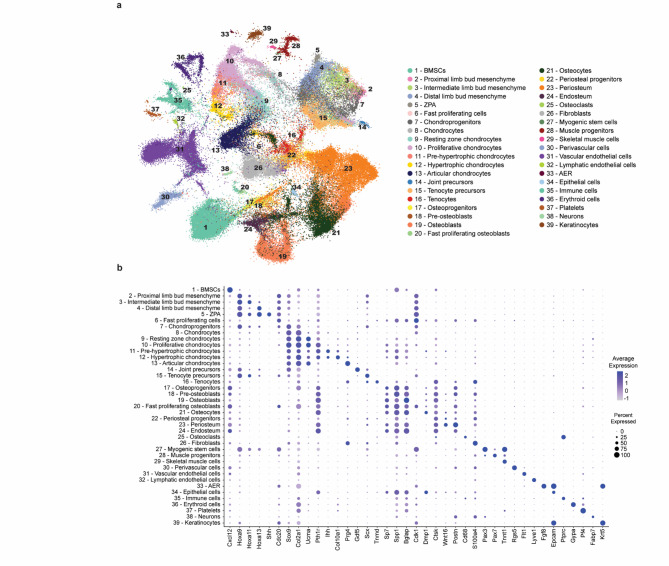
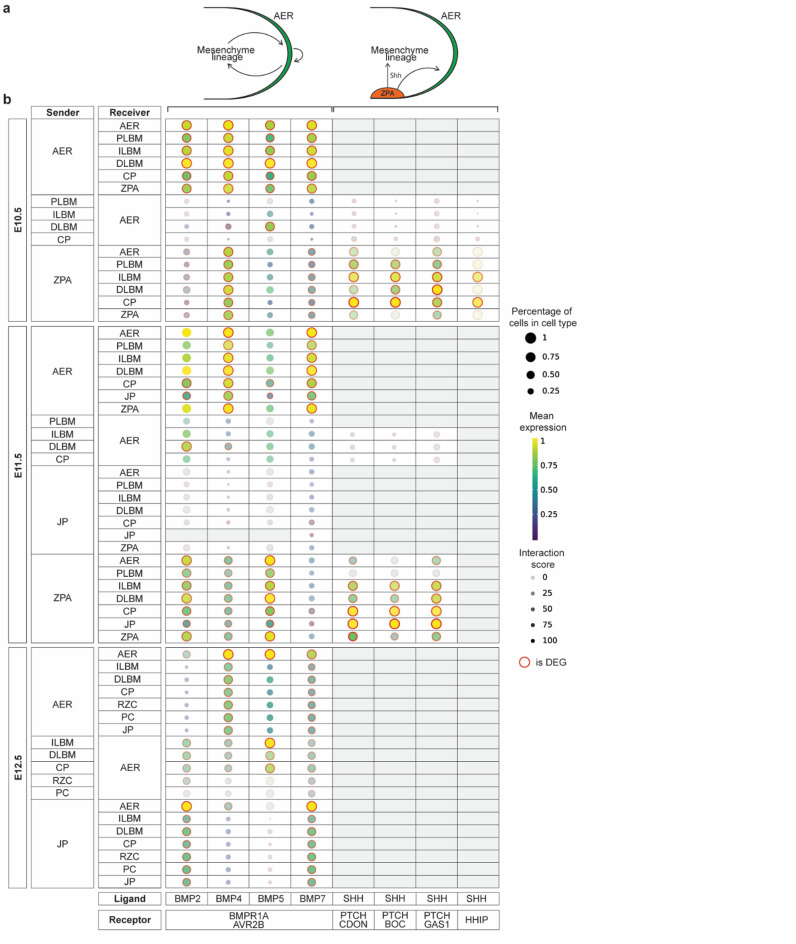
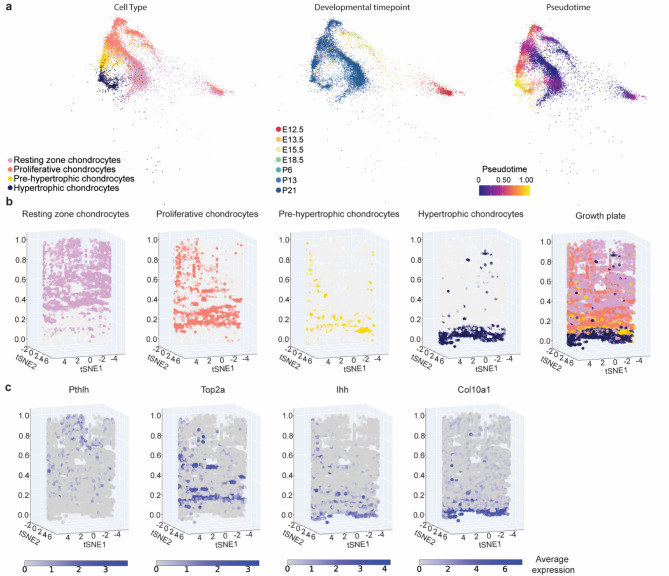
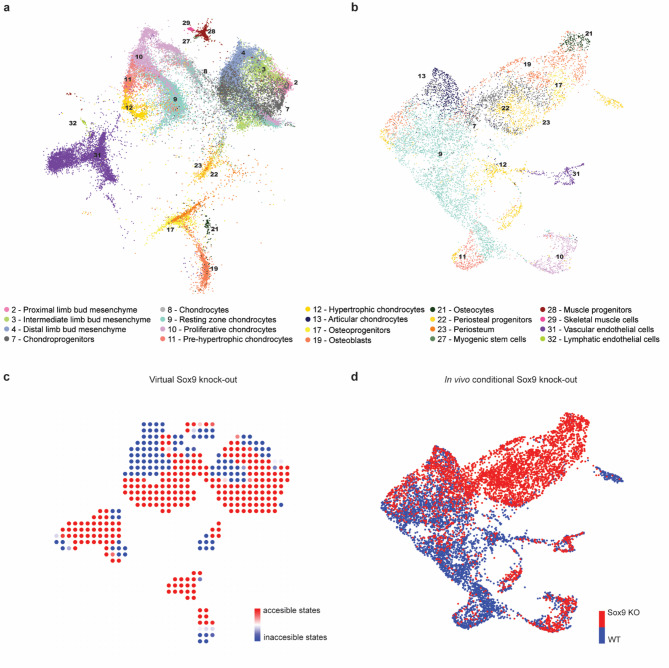
The recent growth of single-cell transcriptomics has made single-cell RNA sequencing (scRNA-seq) into a near-routine technique. Breakthroughs in scalability have led to the creation of organism-wide transcriptomic datasets, aiming to comprehensively profile the cell types and states within an organism throughout its lifecycle. However, the skeleton remains an underrepresented organ system in organism-wide atlases. Given the skeleton's critical role as the central framework of the vertebrate body, its function in housing the hematopoietic niche, and its involvement in metabolic and homeostatic processes, its underrepresentation presents a significant gap in current reference atlas projects. To address this issue, we integrated ten separate murine, publicly available scRNA-seq datasets, which include limb skeletal cells and their developmental precursors, resulting in an atlas of 133,332 cells. This limb skeletal cell atlas describes cells within the mesenchymal lineage, focusing on the process from limb induction to adult bone formation, and encompasses 39 well-characterized cell types and states. By expanding the repertoire of time points and cell types within a single dataset, we enable more complete analyses of cell-cell communication or in silico perturbation studies. Together, these efforts present a valuable resource for researchers in skeletal biology, metabolism, and regenerative medicine, filling an important gap in current atlas mapping projects.

Keywords: Atlas; Bioinformatics; Bone; Limb; Morphogenesis; Single-cell; Transcriptome.


Conflict of interest statement

Declarations. Competing interests: The authors declare no competing interests.

Figures

Fig. 1
Fig. 1
Flow diagram of computation methods. (1) Publicly available datasets were preprocessed using Cell Ranger and Scater. (2) Individual datasets were then clustered and annotated using Seurat v4. (3) We tested scVI, scANVI, scGen and Scanorama and (4) evaluated them with the scIB benchmarking package. scANVI was used to create the final Limb Skeletal Cell Atlas. (5) Cell-cell interactions for early limb bud signaling pathways were predicted using CellPhoneDB and (6) the growth plate was reconstructed with the use of Monocle3 pseudotemporal ordering. (7) Finally, an in silico knockout simulation for Sox9 was performed with Monocle3 and CellOracle and (8) evaluated with in vivo wild-type and knockout data integrated/projected with Harmony and scvi-tools. WT wild-type, KO knockout
Fig. 2
Fig. 2
An integrated compendium of skeletal cell types with detailed annotation. a UMAP visualization of the scANVI latent space of 133 332 murine limb mesenchyme- and skeleton-derived cells, colored by annotation. b Dot plot showing the expression of one selected marker gene per cluster. The color of the dot represents the mean expression level and its size represents the percentage of cells within the cluster in which that gene was detected. For visual clarity, a single representative gene was chosen per cell type, prioritizing specificity over abundance. This visualization is intended to illustrate the distinctiveness of each cluster. Full marker combinations used for annotation are provided in Supplementary Table 2. BMSCs bone marrow-derived stromal cells, ZPA zone of polarizing activity, AER apical ectodermal ridge
Fig. 3
Fig. 3
BMP and SHH signaling case study between AER, ZPA and mesenchyme. a Schematic illustration for visualizing AER and ZPA signaling. b Predicted ligand-receptor interactions across developmental timepoints (E10.5, E11.5 and E12.5). The dot plot illustrates ligand-receptor interactions between sender and receiver cell types (y-axis) and ligand-receptor pairs (x-axis). Dot color indicates mean gene expression, while dot size represents the proportion of cells within each cell type expressing the gene. Translucency reflects interaction specificity and differentially expressed genes are marked with an outer red ring. DEG differentially expressed genes, AER apical ectodermal ridge, PLBM proximal limb bud mesenchyme, ILBM intermediate limb bud mesenchyme, DLBM distal limb bud mesenchyme, CP chondroprogenitors, RZC resting zone chondrocytes, PC proliferative chondrocytes, PHC pre-hypertrophic chondrocytes, JP joint precursors, ZPA zone of polarizing activity
Fig. 4
Fig. 4
Pseudospatiotemporal reconstruction of the transcriptional dynamics within the growth plate. a UMAP visualization of the scANVI latent space of the integrated growth plate data subset from the main atlas, colored by annotation (left), developmental timepoint (middle) and Monocle 3 pseudotime value (right). b Growth plate chondrocytes were grouped in 50 bins based on similar pseudotime values. t-SNE dimensional reduction was performed on each bin, using a circle with a radius of 20 as the boundary condition for gradient descent, thus reconstructing the cylindrical shape of the growth plate upon stacking the bins. c Expression of known marker genes across different growth plate zones in pseudotime and pseudospatial dimensions
Fig. 5
Fig. 5
In silico predictions of Sox9 knockout (KO) compared to in vivo data. a Reference annotation of the subsetted atlas, which includes only the relevant cell types from developmental stages E10.5 to P21, used for knockout analysis. b UMAP plot integrating WT and Sox9 KO in vivo data. c Inner vector product of two vector fields: the pseudotime gradient from unperturbed conditions and the cell state transition probability following in silico Sox9 perturbation. Red regions indicate accessible cell states, while blue regions represent inaccessible cell states. The loss of chondroprogenitor and prehypertophic chondrocyte cell identities as accessible states reflects the biological profile of the ground truth shown in d. Myogenic, osteogenic and endothelial differentiation are largely unaffected. D, UMAP of integrated Sox9 KO and WT in vivo data, representing ground truth affected cell identities colored by condition (red: Sox9 KO, blue: WT)

Similar articles

References

    1. Šromová, V., Sobola, D. & Kaspar, P. A Brief Review of Bone Cell Function and Importance. Cells 12(21), 2576. 10.3390/cells12212576 (2023). - PMC - PubMed
    1. Einhorn, T. A. The cell and molecular biology of fracture healing. Clin. Orthop. Relat. Res.355, S7−21. 10.1097/00003086-199810001-00003 (1998). - PubMed
    1. Florencio-Silva, R., Sasso, G. R. D. S., Sasso-Cerri, E., Simões, M. J. & Cerri, P. S. Biology of Bone Tissue: Structure, Function, and Factors That Influence Bone Cells. BioMed Res. Int. 421746. 10.1155/2015/421746 (2015). - PMC - PubMed
    1. Kwon, M., Kim, B. S., Yoon, S., Oh, S.-O. & Lee, D. Hematopoietic Stem Cells and Their Niche in Bone Marrow. Int. J. Mol. Sci.25(13), 6837. 10.3390/ijms25136837 (2024). - PMC - PubMed
    1. Asp, M. et al. A Spatiotemporal Organ-Wide Gene Expression and Cell Atlas of the Developing Human Heart. Cell 179, 1647−1660. 10.1016/j.cell.2019.11.025 (2019). - PubMed

LinkOut - more resources