Case Reports
. 2025 Jul 2;15(1):22849.
doi: 10.1038/s41598-025-06477-w.

Genotype-integrated single-cell transcriptome analysis reveals the role of DDX41 pR525H in a patient with myelodysplastic neoplasms

Affiliations
Case Reports

Genotype-integrated single-cell transcriptome analysis reveals the role of DDX41 pR525H in a patient with myelodysplastic neoplasms

Hirotaka Matsui et al. Sci Rep. .

Abstract

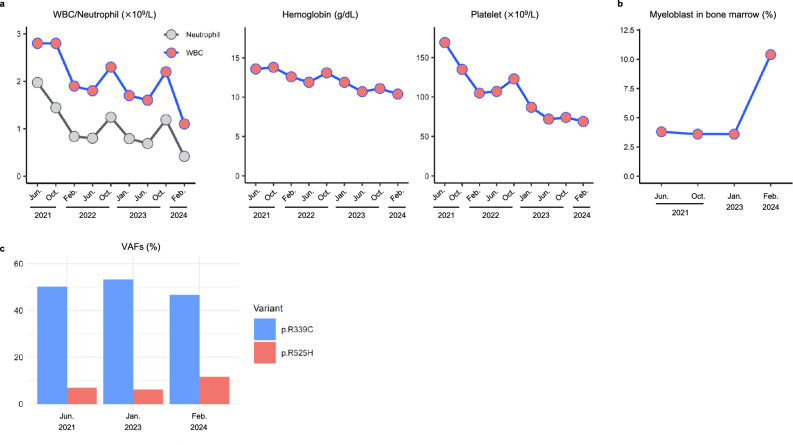
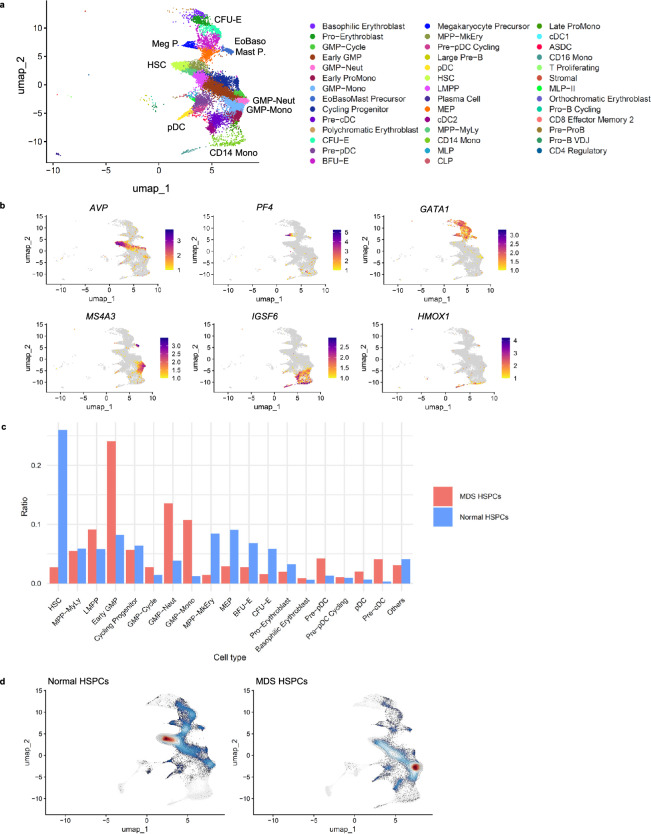
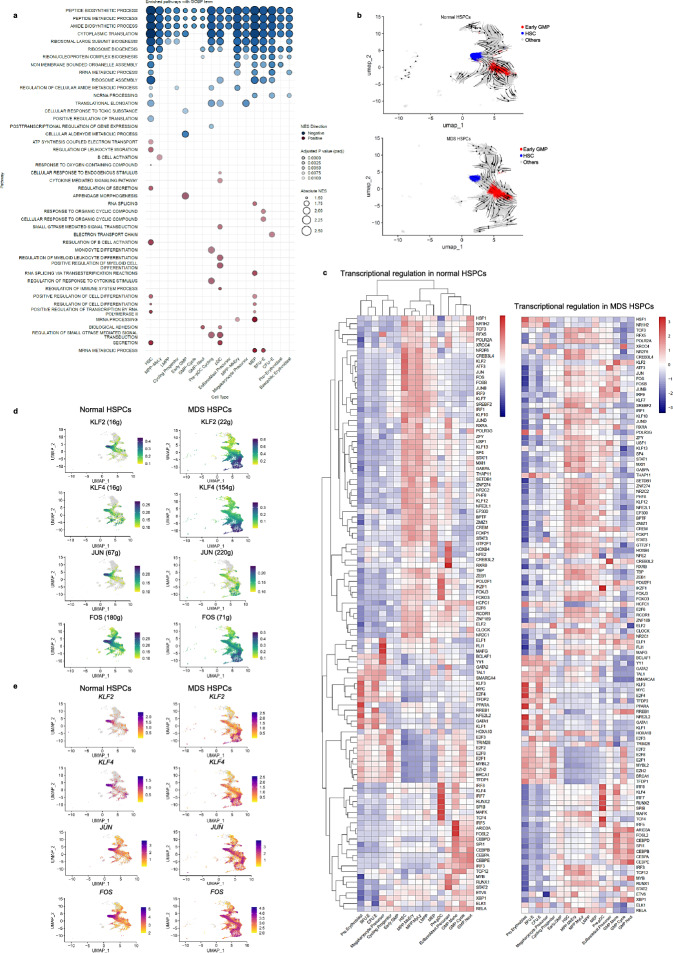
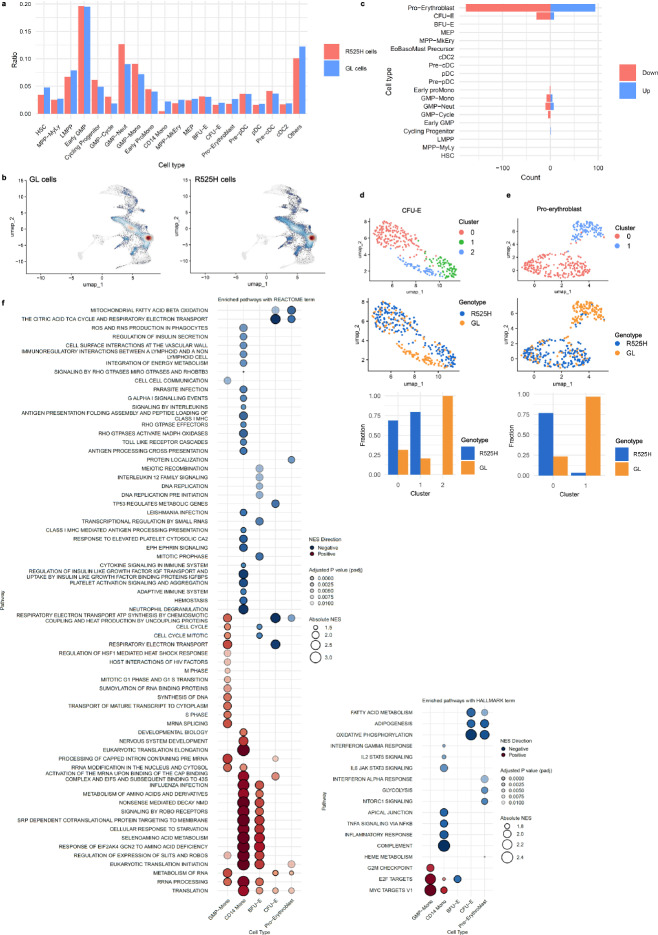
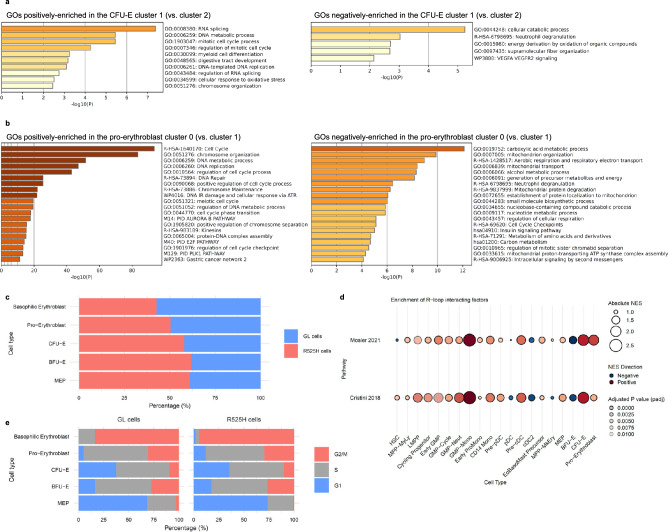
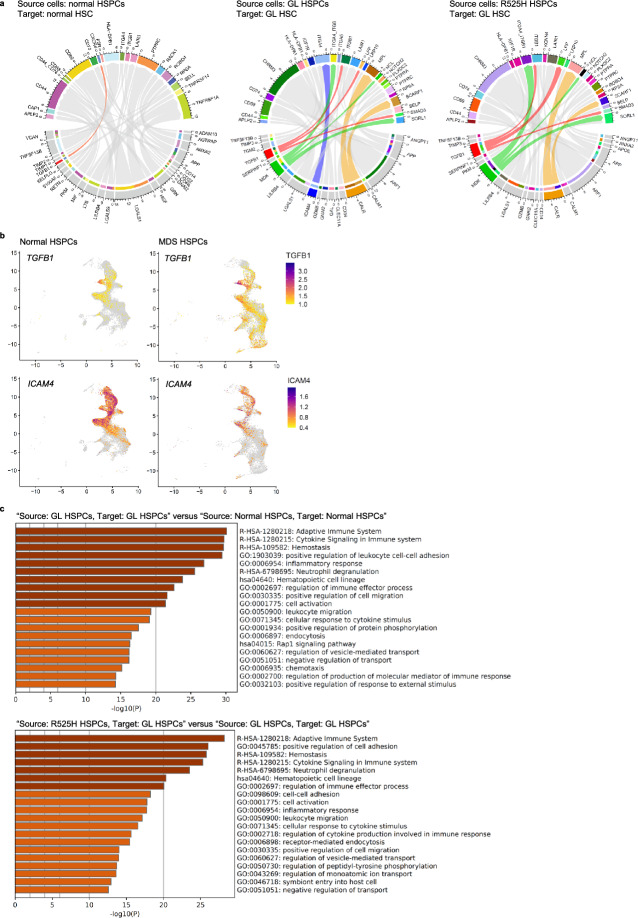
DEAD-box helicase 41 (DDX41) is implicated in germline (GL)-predisposed myeloid neoplasms, where pathogenic GL variants often lead to disease following the acquisition of a somatic variant in trans, most commonly p.R525H. However, the precise molecular mechanisms by which DDX41 variants contribute to the pathogenesis of myeloid neoplasms remain poorly understood, partly due to challenges in establishing cellular and animal models that faithfully recapitulate the human disease phenotype. This limitation highlights the necessity of directly analyzing primary human disease cells. In this case report, conducted to pursue this objective, we implemented single-cell RNA sequencing integrated with genotyping at the p.R525 locus in a myelodysplastic neoplasm (MDS) harboring both germline and somatic DDX41 variants, leveraging highly efficient Terminator-Assisted Solid-phase cDNA amplification and sequencing. We found that acquiring p.R525H induced G2/M cell cycle arrest selectively in colony-forming unit-erythroid cells, accompanied by R-loop accumulation, which impaired erythropoiesis through DNA damage. In hematopoietic stem and myeloid progenitor populations, gene expression profiles were largely similar between p.R525H-positive and -negative cells. However, ligand-receptor interaction and transcriptional regulation analyses suggested a non-cell-autonomous influence from p.R525H-expressing cells on GL variant-only cells. This interaction drove convergence toward a shared expression profile, highlighting an intricate interplay shaping the patient's MDS phenotype.

Keywords: DDX41; Cell-cycle arrest; Myeloid neoplasms with germline predisposition; Single-cell transcriptome; p.R525H variant.


Conflict of interest statement

Declarations. Competing interests: S.S. reports an advisory role for ImmunoGeneTeqs, Inc.; stock for ImmunoGeneTeqs, Inc. but declares no non-financial competing interests. H.M. serves as a member of the journal’s editorial board. The other authors declare no financial or non-financial competing interests.

Figures

Fig. 1
Fig. 1
Clinical course of the MDS case analyzed in this study. (a) Trends in hematological parameters over time, including white blood cell (WBC) counts, neutrophil counts, hemoglobin levels, and platelet counts. (b) Temporal changes in the percentage of myeloblasts observed in bone marrow. (c) Longitudinal analysis of VAFs for the DDX41 variants identified in the analyzed case.
Fig. 2
Fig. 2
Characterization of CD34-positive bone marrow cells and comparison with healthy donor samples. (a) UMAP plot of CD34-positive bone marrow cells, displaying 41 distinct cell types classified using the BoneMarrowMap R package. (b) UMAP distribution of cell type-specific gene expression. Representative expression patterns are shown for HSCs (AVP), megakaryocytic progenitors (PF4), erythroid progenitors (GATA1), monocytic progenitors and EoBasoMast precursors (MS4A3), dendritic cells and monocytes (IGSF6), and monocytes (HMOX1). (c) Proportion of classified cell types within CD34-positive HSPCs. The plot displays the relative abundance of each cell type in the MDS case and three healthy donor samples. (d) Density distribution of cells visualized on UMAP. The MDS sample is contrasted with a combined dataset of three healthy donors, using the ‘plot_Projection_byDonor’ function from the BoneMarrowMap R package. Cell name abbreviations: ASDC, AXL + Siglec-6 + dendritic cells; BFU-E, burst forming unit-erythroid; cDC, conventional dendritic cell; CLP, common lymphoid progenitor; EoBasoMast Precursor, eosinophil, basophil, and mast cell precursor; GMP-Mono, GMP-monocyte; GMP-Neut, GMP-neutrophil; MEP, megakaryocyte-erythroid progenitor; MLP, multi-lymphoid progenitor; Mono, monocyte; MPP-MkEry, multipotent progenitors with megakaryocyte-erythroid priming; MPP-MyLy, multipotent progenitors with myeloid-lymphoid priming; pDC, plasmacytoid dendritic cell; Pre-B, pre-B lymphocyte; Pro-B, pro-B lymphocyte; ProMono, pro-monocyte. Gene name abbreviations: AVP, arginine vasopressin; GATA1, GATA binding protein 1; HMOX1, heme oxygenase 1; IGSF6, immunoglobulin superfamily member 6; MS4A3, membrane spanning 4-domains A3; PF4, platelet factor 4.
Fig. 3
Fig. 3
Distinct transcriptional regulations of CD34-positive HSPCs between MDS case and healthy donors. (a) Bubble plot of GSEA results for each cell type with ≥ 100 cells in both normal and MDS HSPCs. Pathways classified under Gene Ontology Biological Processes (GOBP) categories with adjusted p-values (padj) < 0.01 are displayed. Positively enriched pathways in MDS HSPCs are shown in red, while negatively enriched pathways are in blue. Circle size corresponds to the Nominal Enrichment Score (NES), and color intensity reflects statistical significance (padj). (b) Cell state transitions inferred by scVelo. Differentiation trajectories based on RNA velocity (unspliced/spliced transcripts) are visualized as arrows overlaid on the UMAP, highlighting HSC (blue) and early GMP (red). (c) Heatmap of transcriptional regulation by cell type, depicting average area under the curve (AUC) scores for transcription factors calculated per cell. Only cell types with > 100 cells in both normal and MDS HSPCs are included. The MDS heatmap is aligned with the healthy donor heatmap. (d) UMAP plot visualizing transcriptional regulation at the single-cell level through AUC scores. (e) UMAP plot illustrating transcription factor expression at the single-cell level. Numbers beside gene names indicate the count of target genes regulated by each transcription factor.
Fig. 4
Fig. 4
Comparison of R525H and GL cells by scRNA-seq analysis combined with single-cell genotyping. (a) Proportion of classified cell types, illustrating the relative abundance of each cell type in R525H and GL populations. (b) Density distribution of R525H and GL cells, highlighting population differences across the UMAP projection. (c) Differential gene expression between R525H and GL cells across cell types. Bars indicate the number of differentially expressed genes (p < 0.05), with upregulated genes in R525H cells shown in blue and downregulated genes in red. (d,e) UMAP plots showing re-clustering results for CFU-E (d) and pro-erythroblast (e) populations. Upper panels: UMAP projections with clusters. Middle panels: Cells distinguished by genotype (R525H or GL), with color-coded labels. Lower panels: Bar graphs illustrating relative fractions of R525H and GL cells within each cluster. (f) GSEA comparison of R525H and GL cells, highlighting enriched REACTOME and HALLMARK pathways (padj < 0.01). Only cell types containing at least one pathway with padj < 0.01 are displayed. Pathways positively enriched in R525H cells are shown in red, and negatively enriched pathways in blue. Circle size represents the NES, while color intensity indicates statistical significance (padj).
Fig. 5
Fig. 5
Impaired erythroid differentiation by the acquisition of p.R525H. (a,b) Pathway enrichment analysis. (a) CFU-E cluster 1 (vs. cluster 2) pathway. (b) Pro-erythroblast cluster 0 (vs. cluster 1) pathway. Differentially expressed genes (padj < 0.05) were identified via Seurat’s ‘FindMarkers’ function and analyzed in Metascape (https://metascape.org). (c) Proportion of R525H cells relative to GL cells in erythroid progenitors, visualized as a 100% stacked bar chart for each cell type. (d) Enrichment of R-loop-interacting factors, in R525H and GL cells. GSEA used curated factors in GMT format, with positive and negative enrichments in R525H cells shown in red and blue, respectively. Circle size represents NES, and color intensity indicates padj. (e) Cell cycle status estimates in erythroid progenitor. Seurat’s ‘CellCycleScoring’ function assessed phase distribution (G1, S, G2/M), presented as a 100% per-phase bar.
Fig. 6
Fig. 6
Different ligand-receptor interactions between normal and MDS HSPCs and between R525H and GL cells. (a) Chord diagrams illustrating cell-to-cell interactions within healthy HSPCs, within GL cells, and from R525H cells to GL cells. Key ligand-receptor interactions are highlighted with color-coded connections referenced in the text. (b) Expression patterns of TGFB1 and ICAM4, in normal and MDS HSPCs, visualized on UMAP plots. (c) Pathway enrichment analysis. Significant interaction differences (p < 0.01) between normal and GL cells (upper), and between R525H and GL cells (lower), analyzed using associated ligand and receptor names.

Similar articles

References

    1. Khoury, J. D. et al. The 5th edition of the World Health Organization Classification of haematolymphoid tumours: Myeloid and histiocytic/dendritic neoplasms. Leukemia36, 1703–1719. 10.1038/s41375-022-01613-1 (2022). - PMC - PubMed
    1. Arber, D. A. et al. International Consensus Classification of Myeloid Neoplasms and Acute Leukemias: integrating morphologic, clinical, and genomic data. Blood140, 1200–1228. 10.1182/blood.2022015850 (2022). - PMC - PubMed
    1. Klco, J. M. & Mullighan, C. G. Advances in germline predisposition to acute leukaemias and myeloid neoplasms. Nat. Rev. Cancer.21, 122–137. 10.1038/s41568-020-00315-z (2021). - PMC - PubMed
    1. Polprasert, C. et al. Inherited and somatic defects in DDX41 in myeloid neoplasms. Cancer Cell27, 658–670. 10.1016/j.ccell.2015.03.017 (2015). - PMC - PubMed
    1. Shinriki, S. & Matsui, H. Unique role of DDX41, a DEAD-box type RNA helicase, in hematopoiesis and leukemogenesis. Front. Oncol.12, 992340. 10.3389/fonc.2022.992340 (2022). - PMC - PubMed

Publication types

Substances