. 2025 Jul 1;15(1):20749.
doi: 10.1038/s41598-025-05452-9.

Applied anatomy and morphology of Meibomian glands in the non-human primate

Affiliations

Applied anatomy and morphology of Meibomian glands in the non-human primate

Isabel Y Moreno et al. Sci Rep. .

Abstract

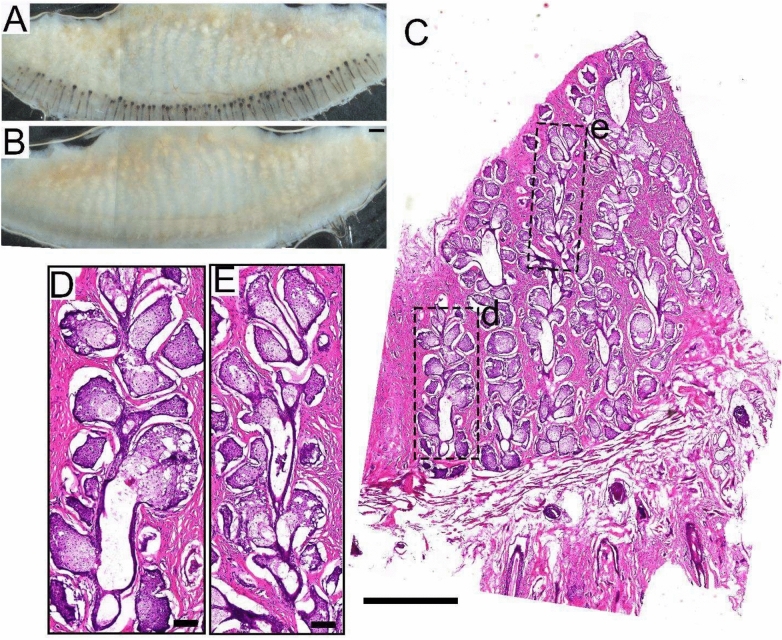
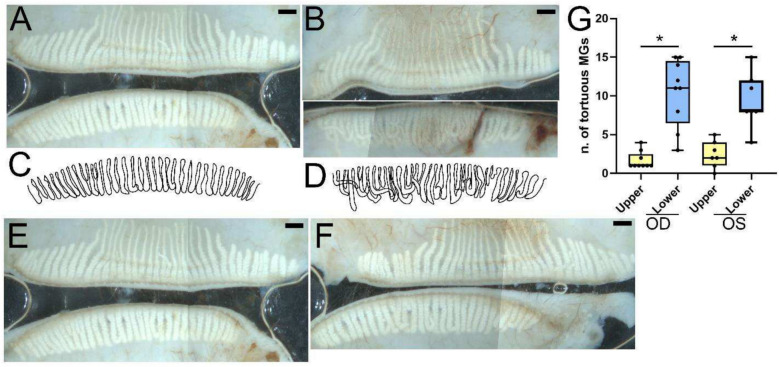
Dry eye disease (DED) is a common ocular condition that has been estimated to affect ~ 10 to 55.4% of the global population. Symptoms of DED include eye irritation, ocular pain and discomfort, inflammation, and photophobia, and, if left untreated, can lead to infection, corneal neuropathy, corneal scarring and impaired vision. Studies have shown that over 70% of all DED cases are caused by some form of Meibomian gland dysfunction (MGD). To date the etiology of MGD remains unknown, therefore, there is a need for further research into understanding the development, homeostasis and pathology of the Meibomian gland (MG). Various animal models, such as, the murine, rabbit and canine models, have provided valuable insights into the physiopathology of MGD, however, there are many limitations when comparing these models to human MGD. The nonhuman primate (NHP) model is closely related to humans and develops many diseases comparable to humans. This study aimed to characterize the anatomy and morphology of the NHP Macaca mulatta MGs compared to humans. MGs were analyzed by whole mount imaging and histology in the eyelids of NHPs of various ages ranging from ~ 3 months to 12 years. NHPs presented serially arranged MGs within the upper and lower tarsal plate with similar gland morphology to that of humans. Curiously, in the upper lid, the centrally located glands presented a distal portion that is thinner than the remaining glands, with meibocytes directly lining the central collecting duct instead of forming acinar structures. MG atrophy and drop-out were evident in both upper and lower eyelids of NHPs from 6 years of age, increasing in severity with age. Both MG tortuosity and hooking were observed in the NHPs at all ages, being more prevalent in the lower eyelids than in the upper eyelids. Taken together, our findings show that the NHP could be a valuable model for studying MG development, homeostasis and pathology, including Age Related MGD (ARMGD).

Keywords: Aging; Meibomian gland; Non-human primate; Ocular surface.


Conflict of interest statement

Declarations. Competing interests: The authors declare no competing interests.

Figures

Fig. 1
Fig. 1
Anatomical and morphological features of the MGs of M. mulatta. (A) Eyelids were collected from M. mulatta and cleaned for whole mount imaging of the upper and lower MGs. A representative image was selected from a young M. mulatta (< 3 months) (B) The eyelids were then flat mounted and embedded for frozen sectioning to obtain coronal sections through the MGs. M. mulatta MGs were stained with H&E and digital images acquired of a section of the upper (B) and lower (E) eyelid under a LEICA microsystem DMi8 Inverted Microscope using spiral imaging. The eyelid margin is oriented towards the bottom of the image. (C and D) Higher magnification images of areas demarcated with a c and d in B are shown to evidence the detailed organization of the MG acinar cells along the collecting duct. (F) Higher magnification image of area demarcated in f in panel E showing the central collecting duct with connecting acini. Scale bar in panel A represents 1 mm, scale bar in panels B and E represents 1000 µm and scale bar in panels C, D and F represents 100 µm.
Fig. 2
Fig. 2
Anatomical and morphological features of the MGs with human eyelids. Human upper eyelids were obtained and cleaned for whole mount imaging. Representative images are shown of the MGs from a 40 year old human from the skin side (A) and conjunctival side (B). (C) The eyelids were then flat mounted and embedded for frozen sectioning to obtain coronal sections through the MGs. The MGs were stained with H&E and a section scanned under a LEICA microsystem DMi8 Inverted Microscope using spiral imaging. The eyelid margin is oriented towards the bottom of the image. (D and E) Higher magnification images of areas demarcated by d and e in C showing a central collecting duct and surrounding acini in an area that is more proximal and distal to the eyelid margin, respectively. Scale bar in panel A represents 1 mm, scale bar in panel (C) represents 1000 µm and the scale bar in panels (D) and (E) represents 100 µm.
Fig. 3
Fig. 3
Distribution of lipids throughout the MGs of M. mulatta. (A) ORO staining of a young (< 3 months) M. mulatta upper eyelid. (C, D, and E) Higher magnification images of areas demarcated by c, d, and e in panel A. (B) ORO staining of a young (< 3 months) M. mulatta lower eyelid. (F) Higher magnification of area demarcated by f in panel B showing ORO staining in the lower eyelid. Scale bar panels (A) and (B) represents 1000 µm and the scale bar represent 100 µm in (C), (D), (E) and (F).
Fig. 4
Fig. 4
Distribution of lipids throughout human MGs. (A) A section of a 40 year old female eyelid was stained with ORO and image under a LEICA microsystem DMi8 Inverted Microscope using spiral imaging. (B, C) Higher magnification images of areas demarcated by b and c in panel (A) showing the lipid droplets present in the central collecting duct, acini, and meibocytes of the upper eyelid. Scale bar panel (A) represents 1000 µm and for panels (B) and (C) represents 100 µm.
Fig. 5
Fig. 5
MG tortuosity in the M. mulatta. (A) Representative whole mount images of the upper and lower MGs of a 6 month old M. mulatta showing minimal distorted, hooked, and tortuous glands. (B) Representative whole mount images of the upper and lower MGs of a 6 month old M. mulatta with many distorted, hooked, and tortuous glands. (C and D) The outline of the MGs in (A) and (B) were traced (black line) to aid in the visualization of the individual glands and presented. (E) Representative images of the MGs within the left eyelid of a young animal less than 3 months (110 days), (F) Representative image of the MGs within the right eyelid of the same young animal (110 days), and (G) The total number of tortuous glands in the left (OS) and right (OD) upper and lower MGs of M. mulatta at different ages were quantified and presented as a box plot. *Represents p ≤ 0.05 calculated using the unpaired student t-test and ANOVA followed by a Tukey’s post hoc test yielding a similar outcome. Scale bar represents 1 mm.
Fig. 6
Fig. 6
Whole mount images of M. mulatta MGs at different ages. (A) Representative upper and lower whole mount images of MGs of 6 year, 10 year, and 12 year old M. mulatta. Arrows indicate MG atrophy and asterisks indicate MG dropout. (B) Scatter plot of the number of atrophic MGs (y-axis) present in the upper eyelid of M. mulatta per age (x-axis). (C) Scatter plot of the number of atrophic MGs (y-axis) present in the lower eyelid of M. mulatta per age (x-axis). (D) Scatter plot of the number of MG drop-out (y-axis) present in the upper eyelid of M. mulatta per age (x-axis). (E) Scatter plot of the number of MG drop-out (y-axis) present in the lower eyelid of M. mulatta per age (x-axis). (F) Representative images of the upper and lower whole mounted eyelid showing the MGs of a 12 year old M. mulatta with severe MGD. (G) Representative images of the upper and lower whole mounted eyelid showing the MGs of a 11 year old M. mulatta that presents ghost glands, indicated within the dashed rectangle. Scale bar represents 1 mm.
Fig. 7
Fig. 7
Histological features of healthy MGs (top row), MGs undergoing atrophy (middle row), and regions that have undergone MG drop out (bottom row) in the upper eyelids M. mulatta. Representative regions of the MG are shown as a whole mount image (first image), and the same region is then shown following H&E staining (middle image). The area demarcated in the representative H&E image (middle panel) is then shown in higher magnification to the right (last panel). The solid arrows indicate areas presenting a residual central collecting duct following MG atrophy/drop-out. The empty arrow indicates a region of the MG that has undergone atrophy within a more central region of a MG. Scale bars in whole mount images represent 1 mm and the scale bar within the histological images represents 100 µm.
Fig. 8
Fig. 8
Histological features of healthy and atrophic glands in the lower eyelid of M. mulatta. Anatomical and histological features of healthy MGs (top two images) and MGs undergoing atrophy (bottom two images) in the lower eyelids M. mulatta. A representative whole mount image is presented of a 6 year M. mulatta demonstrating healthy glands. The eyelid was then processed for histology and stained with H&E digital images acquired using spiral imaging and a representative H&E image of the area indicated by a dashed rectangle within the whole mounted image is shown below. A representative whole mount image is presented of a 12 year M. mulatta demonstrating atrophic glands. The eyelid was then processed for histology and stained with H&E and digital images acquired using spiral imaging and a representative H&E image of the area indicated by a dashed rectangle within the whole mounted image is shown below. Scale bars in whole mount images represent 1 mm and the scale bar within the histological images represents 100 µm.

Similar articles

References

    1. Verma, S. et al. Meibomian gland development: Where, when and how?. Differentiation132, 41–50. 10.1016/j.diff.2023.04.005 (2023). - PMC - PubMed
    1. Knop, E., Knop, N., Millar, T., Obata, H. & Sullivan, D. A. The international workshop on Meibomian gland dysfunction: Report of the subcommittee on anatomy, physiology, and pathophysiology of the Meibomian gland. Invest. Ophthalmol. Vis. Sci.10.1167/iovs.10-6997c (2011). - PMC - PubMed
    1. Knop, N. & Knop, E. Meibomian glands. Part I: anatomy, embryology and histology of the Meibomian glands. Ophthalmologe106(10), 872–883. 10.1007/S00347-009-2006-1 (2009). - PubMed
    1. Andrews, J. S. The Meibomian secretion. Int. Ophthalmol. Clin.13(1), 23–28. 10.1097/00004397-197301310-00004 (1973). - PubMed
    1. Sun, M., Moreno, I. Y., Dang, M. & Coulson-Thomas, V. J. Meibomian gland dysfunction: What have animal models taught us? (2020). 10.3390/ijms21228822. - PMC - PubMed

LinkOut - more resources