. 2025 Jul 1;15(1):22021.
doi: 10.1038/s41598-025-05107-9.

Machine learning unveils hypoxia-immune gene hub for clinical stratification of thyroid-associated ophthalmopathy

Affiliations

Machine learning unveils hypoxia-immune gene hub for clinical stratification of thyroid-associated ophthalmopathy

Lu Chen et al. Sci Rep. .

Abstract

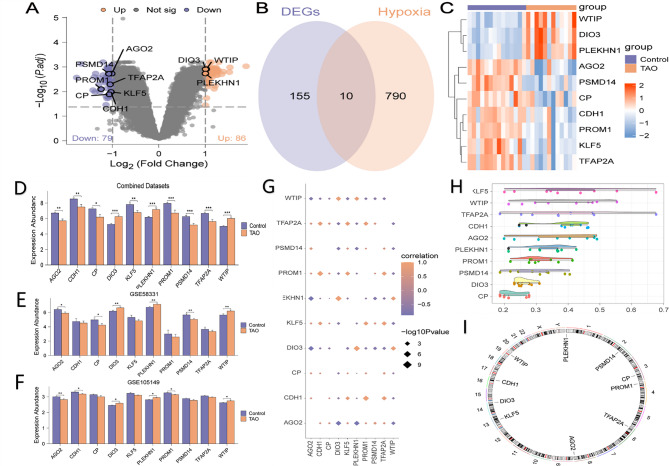
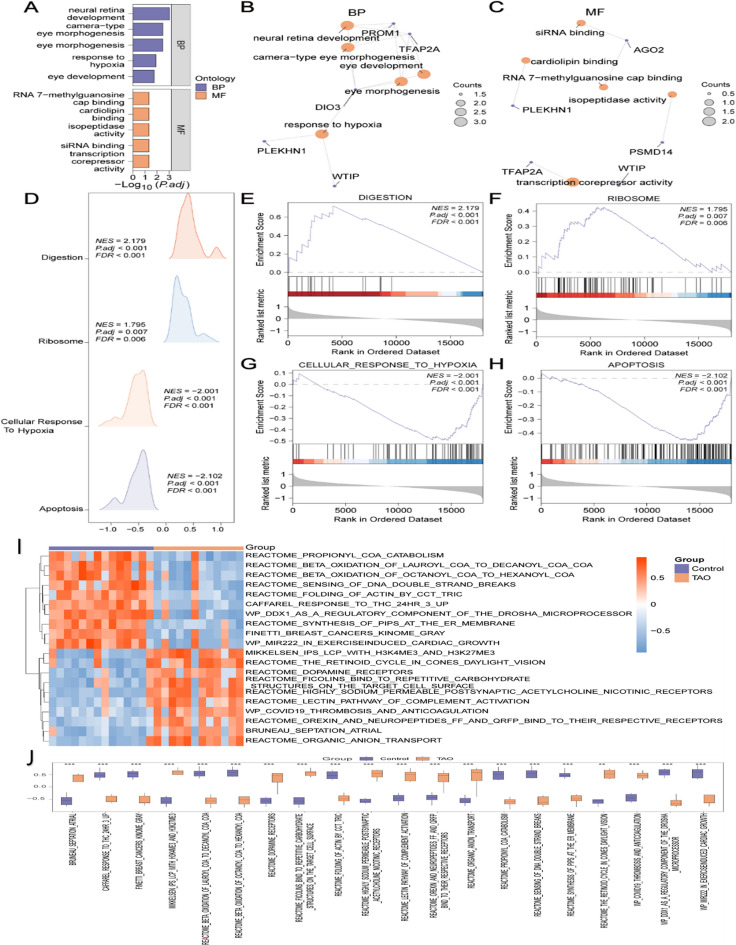
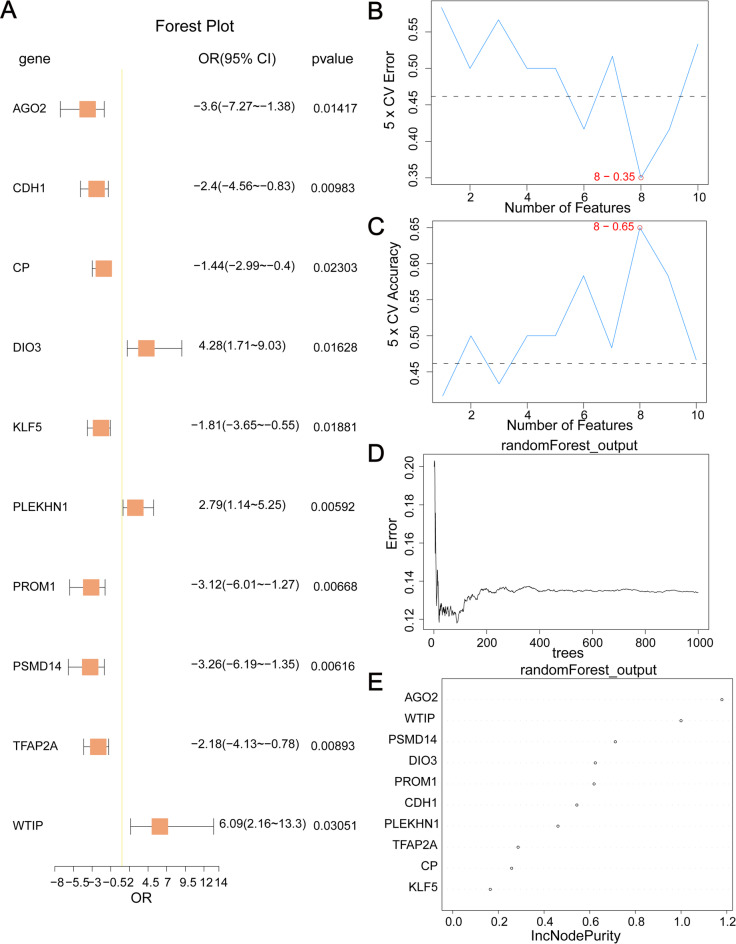
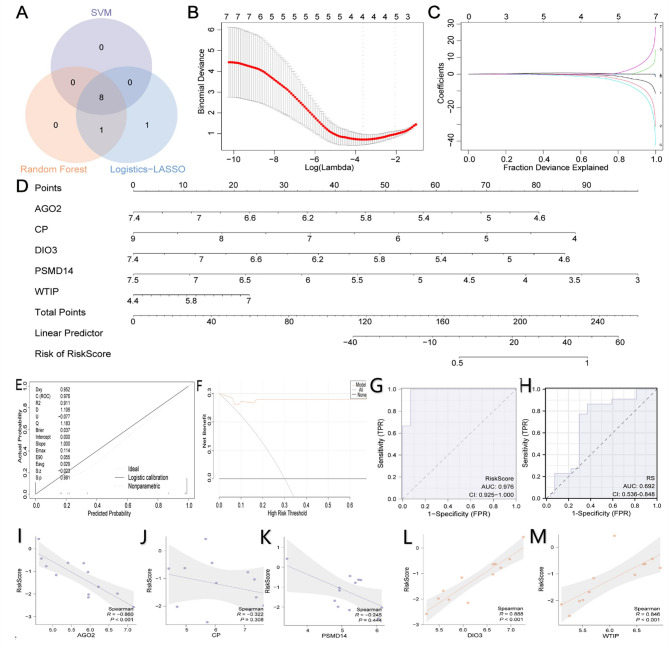
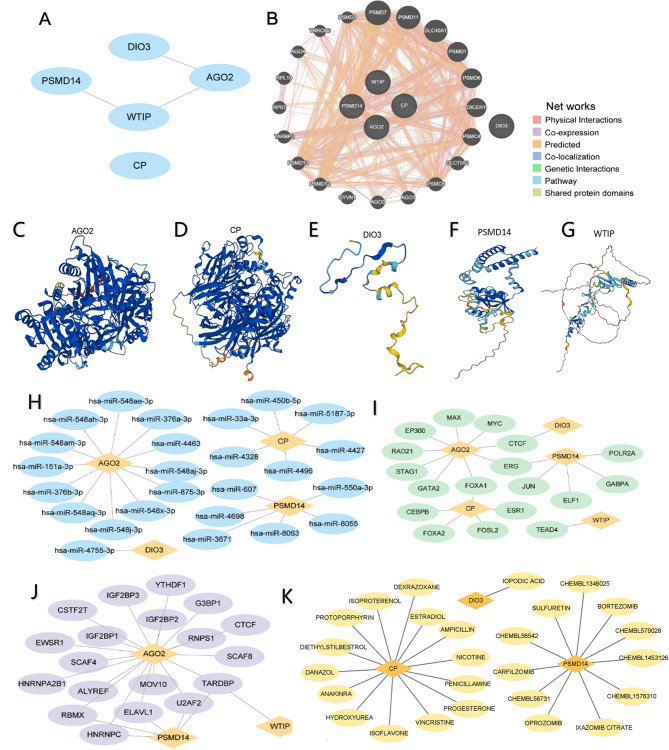
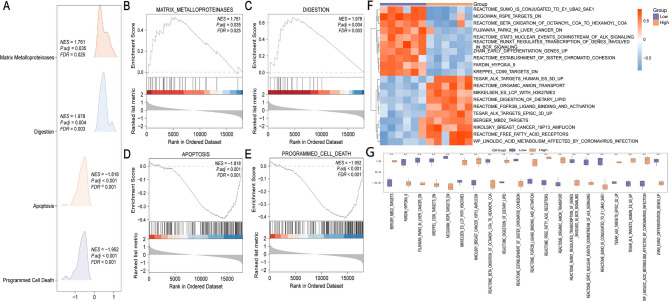
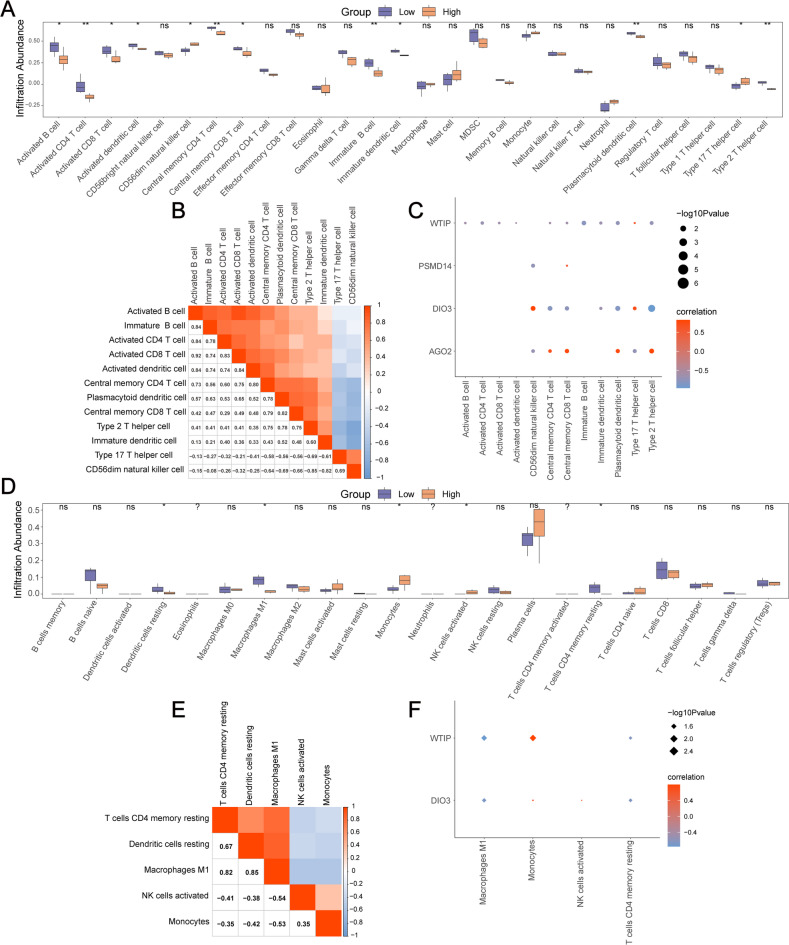
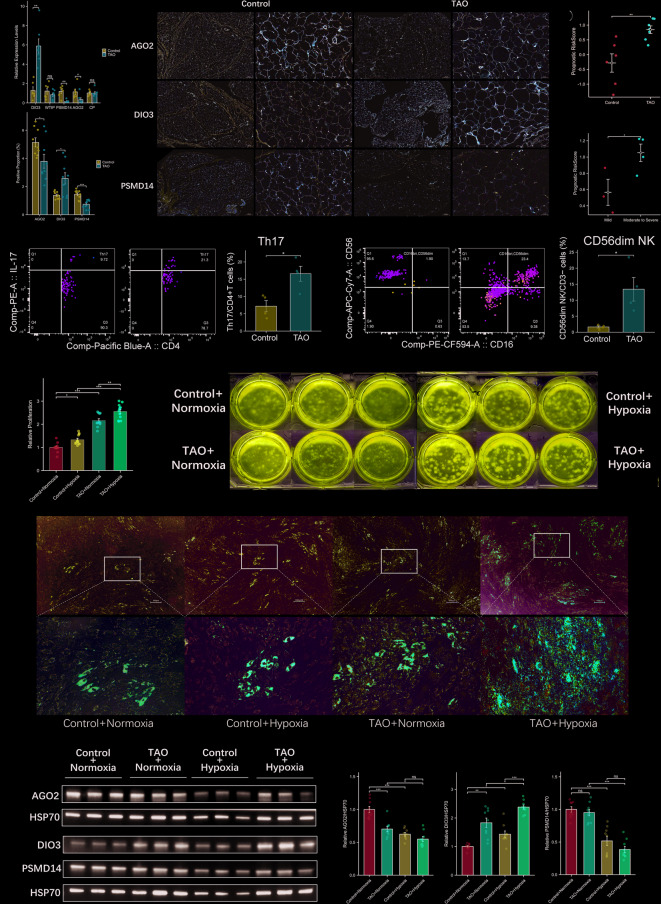
Thyroid-associated ophthalmopathy (TAO) is an autoimmune disorder affecting the orbit, potentially resulting in blindness. This study focused on the role of hypoxia in its pathogenesis through integrative bioinformatics and experimental validation. Five differentially expressed genes associated with hypoxia (HRDEGs) were identified via Gene Expression Omnibus (GEO) database mining: AGO2, CP, DIO3, PSMD14, WTIP. qPCR and immunohistochemistry confirmed reduced expressions of AGO2 and PSMD14, and elevated expression of DIO3 in TAO orbital tissues. Hypoxia exposure aggravated the above dysregulation and promoted proliferation and adipogenesis of orbital fibroblasts. A predictive model was developed using four machine learning algorithms and validated for its effectiveness in diagnosing TAO and assessing disease severity. Functional enrichment revealed hypoxia response, apoptosis, and programmed cell death. Protein-protein interaction and mRNA interaction networks of HRDEGs were established, predicting transcription factors, microRNAs, RNA-binding proteins, and drugs interacting with them. Immune infiltration analysis demonstrated the accumulation of Type 17 T helper cells and CD56 dim natural killer cells in high-risk patients, correlating with DIO3 upregulation and AGO2 downregulation. Flow cytometry confirmed the enrichment of these two cell types in the orbital tissue of TAO. This study revealed hypoxia-immunity crosstalk in TAO pathogenesis, providing a validated predictive model and molecular targets for precision interventions.

Keywords: Hypoxia; Immune microenvironment; Predictive model; Thyroid-associated ophthalmopathy.


Conflict of interest statement

Declarations. Competing interests: The authors declare no competing interests.

Figures

Fig. 1
Fig. 1
Differential expression analysis of the Combined GEO Datasets and Correlation analysis of HRDEGs. (A) Volcano plot illustrating differentially expressed genes (DEGs) between Control and thyroid-associated ophthalmopathy (TAO) groups in the Combined GEO Datasets. (B) Venn diagram of DEGs and hypoxia-related genes (HRGs). The ten genes in the intersection zone are labeled “HRDEGs”. (C) Heat map of HRDEGs: red, high expression; blue, low expression. (DF) Group comparison map of HRDEGs between Control group and TAO group of combined datasets (D), dataset GSE58331 (E) and dataset GSE105149 (F): purple, Control group; orange, TAO group. (G) Dot plot of HRDEGs: orange, positive correlation; purple, negative correlation. (H) Results of functional similarity analysis (Friends) of HRDEGs. (I) Chromosomal mapping of HRDEGs. The absolute value of the correlation coefficient (R) indicates degree of correlation: below 0.3, weak or no correlation; between 0.3 and 0.5, weak correlation; between 0.5 and 0.8, moderate correlation; above 0.8, strong correlation. *p < 0.05, statistically significant; **p < 0.01, highly statistically significant; ***p < 0.001, highly statistically significant.
Fig. 2
Fig. 2
Functional enrichment analysis based on the Control and TAO groups. (A) Bar chart of Gene Ontology (GO) enrichment analysis results of 10 HRDEGs: biological process (BP), molecular function (MF). The ordinate is GO terms. (B, C) GO results network diagram of HRDEGs shown: BP (B), MF (C). (D). Four main biological features from Gene Set enrichment analysis (GSEA) of Combined GEO Datasets. (EH) All genes in the Combined Datasets were significantly enriched in digestion (E), ribosome (F), cellular response to hypoxia (G), and apoptosis (H) pathways. Orange nodes represent entries, green nodes represent molecules, and lines represent the relationship between entries and molecules. (I, J) Heat map (I) and group comparison map (J) of Gene Set Variation Analysis (GSVA) results between the Control and TAO groups of the Combined GEO Datasets. Purple represents the Control group and orange represents the TAO group. The screening criteria for GO enrichment analysis and GSEA were p < 0.05 and FDR value (q value) < 0.05. The screening criteria for GSVA were p < 0.05, and the correction method for the p value was Benjamini-Hochberg (BH). **p < 0.01; ***p < 0.001.
Fig. 3
Fig. 3
Logistic regression, SVM, random forest analysis. (A) Forest Plot of logistic regression analysis of 10 HRDEGs. (B) Number of genes with the lowest error rate obtained by the SVM algorithm. (C) Number of genes with the highest accuracy obtained by SVM algorithm. (D) Model training error plot of random forest algorithm. (E) Random Forest model showing differential genes (in descending order of IncNodePurity).
Fig. 4
Fig. 4
Construction, evaluation and validation of HRDEGs predictive model. (A) Venn diagram showing intersection of HRDEGs based on logistic regression analysis results, SVM model, and random forest model. (B) Predictive model diagram of LASSO regression model. (C) Variable trajectory plot of LASSO regression model. (D) Nomogram of the five hub genes in the HRDEGs predictive model. (E, F) Calibration curve of HRDEGs predictive model (E), DCA plot (F). The ordinate of the Calibration Curve is the net benefit, and the abscissa is the threshold probability. (G, H) ROC curve results of the Risk Score of HRDEGs predictive model in the Combined GEO Datasets (G) and the anterior orbit samples in dataset GSE58331 (H). (IM) Scatter plots of the correlation between RiskScore and hub genes (AGO2 (I), CP (J), PSMD14 (K), DIO3 (L), WTIP (M)) in the Combined GEO Datasets. Orange represents positive correlation; purple represents negative correlation.
Fig. 5
Fig. 5
PPI network and mRNA network. (A) Protein-protein interaction (PPI) Network of hub genes calculated by STRING database. (B) GeneMANIA website predicted the interaction network of hub genes with similar functions. The circles in the figure show the hub genes and the genes with similar functions, and the colors corresponding to the lines represent the interconnected functions: physical interactions, co-expressions, predicted, co-localization, genetic interactions, pathway, and shared protein domains. (CG) Protein structures of hub genes (AGO2 (C), CP (D), DIO3 (E), PSMD14 (F), WTIP (G)) are shown. The degree of confidence in the predicted structure is indicated by the pLDDT value, as follows: pLDDT < 50, low; 50 < pLDDT < 70, moderate; 70 < pLDDT < 90, high. When pLDDT > 90, there is high confidence in the predicted structure. (H) The mRNA-miRNA Regulatory Network of hub genes. (I) mRNA-TF Regulatory Network of hub genes. (J) mRNA-RBP Regulatory Network of hub genes. (K) mRNA-Drug Regulatory Network of hub genes. Orange, mRNA; green, TF; blue, miRNA; purple, RBP; yellow, Drug.
Fig. 6
Fig. 6
Risk group-based functional enrichment analysis. (A) Four main biological features in GSEA of Combined GEO Datasets. (BE) All genes of TAO samples in the Combined GEO Datasets were significantly enriched in matrix metalloproteinases (B), digestion (C), apoptosis (D), and programmed cell death (E). (F, G) Heat map (F) and group comparison map (G) of GSVA results between high-risk (High) and low-risk (Low) groups of Combined Datasets. The significant enrichment screening criteria for GSEA were p < 0.05 and FDR value (q value) < 0.05; the correction method for the p value was Benjamini-Hochberg. *p < 0.05; **p < 0.01. Purple represents the low-risk group and orange the high-risk group. The screening criteria for GSVA was p < 0.05; the p value correction method was Benjamini-Hochberg. In the heat map, red represents high expression and blue low expression.
Fig. 7
Fig. 7
Immune infiltration analysis of TAO samples in combined GEO datasets. (A) Group comparison plots of ssGSEA immune infiltration results for TAO samples in combined datasets. (B) Correlations among ssGSEA-derived immune cell infiltration abundance. (C) Bubble plot of the ssGSEA-derived correlation between immune cells and hub genes. (D) Group comparison plot of CIBERSORT immune infiltration analysis results for TAO samples in combined datasets. (E) Correlations of CIBERSORT-quantified immune cell infiltration abundance. (F) Bubble plot of CIBERSORT-quantified correlation between immune cells and hub genes. The symbol ns indicates p ≥ 0.05, which is not statistically significant. *p < 0.05; **p < 0.01. The bottom left digit of the correlation heat map represents the absolute value of the correlation coefficient (R), indicating the strength of the correlation: R < 0.3, weak or no correlation; R between 0.3 and 0.5, weak correlation; R between 0.5 and 0.8, moderate correlation.
Fig. 8
Fig. 8
Experimental validations of Hub HRDEGs and the predictive model. (A) Expression histogram of hub HRDEGs mRNA expression in orbital adipose connective tissues of Normal controls (blue) and TAO samples (orange). (B, C) immunohistochemical (IHC) staining of AGO2, DIO3, and PSMD14 in orbital adipose connective tissues. Typical images (C, Original magnification×5, ×20) and the positive ratios of all samples (B) from Normal controls (blue) and TAO samples (orange) were presented. (D) Comparison of Risk Scores between Control and TAO groups, blue for Control samples and red for TAO samples. (E) Comparison of Risk Scores between groups with different severity of TAO. Blue is Mild and red is Moderate-to-Severe. (F) The Typical images and proportion of Th17 (CD4+IL17+) cells among CD4+ T cells in orbital tissues of Normal controls (blue) and TAO samples (orange). (G) The Typical images and proportion of CD56dim NK (CD56⁺CD16⁺) cells among CD45+CD3 cells in orbital tissues of Normal controls (blue) and TAO samples (orange). (H) Cell Counting Kit 8 (CCK-8) assay to evaluate cell proliferation of OFs under normoxic or hypoxic atmosphere for 48 h. Blue is OFs from Control group in normoxia, purple is Control in hypoxia, orange is TAO in normoxia, and red is TAO in hypoxia. (I) Colony formation assay of OFs cultured in normoxic or hypoxic environment for one week. (J) Oil Red O staining of OFs cultivated in adipogenesis medium under normoxic or hypoxic atmosphere for 10 days. (KN) The protein expression of AGO2 (L), DIO3 (M), and PSMD14 (N) in OFs from Normal controls and TAO patients under normoxic or hypoxic atmosphere for 7 days. Blue is OFs from Control group in normoxia, orange is TAO in normoxia, purple is Control in hypoxia, and red is TAO in hypoxia.The symbol ns indicates non significance, p ≥ 0.05. *p < 0.05; **p < 0.01.

Similar articles

References

    1. Antonelli, A. et al. Graves’ disease: clinical manifestations, immune pathogenesis (cytokines and chemokines) and therapy. Best Pract. Res. Clin. Endocrinol. Metab.34, 101388. 10.1016/j.beem.2020.101388 (2020). - PubMed
    1. Chin, Y. H. et al. Prevalence of thyroid eye disease in graves’ disease: a meta-analysis and systematic review. Clin. Endocrinol. (Oxf). 93, 363–374. 10.1111/cen.14296 (2020). - PubMed
    1. Bartalena, L. et al. The 2021 European group on graves’ orbitopathy (EUGOGO) clinical practice guidelines for the medical management of graves’ orbitopathy. Eur. J. Endocrinol.185, G43–G67. 10.1530/EJE-21-0479 (2021). - PubMed
    1. Wang, Y. et al. Comprehensive analysis of key genes and pathways for biological and clinical implications in thyroid-associated ophthalmopathy. BMC Genom.23, 630. 10.1186/s12864-022-08854-5 (2022). - PMC - PubMed
    1. Mishra, S. et al. Clinical management and therapeutic strategies for the thyroid-associated ophthalmopathy: current and future perspectives. Curr. Eye Res.45, 1325–1341. 10.1080/02713683.2020.1776331 (2020). - PubMed

MeSH terms

LinkOut - more resources