. 2025 Jul 1;15(1):21686.
doi: 10.1038/s41598-025-05757-9.

Identification of potential pathogenic genes associated with the comorbidity of rheumatoid arthritis and renal fibrosis using bioinformatics and machine learning

Affiliations

Identification of potential pathogenic genes associated with the comorbidity of rheumatoid arthritis and renal fibrosis using bioinformatics and machine learning

Jiao Qiu et al. Sci Rep. .

Abstract

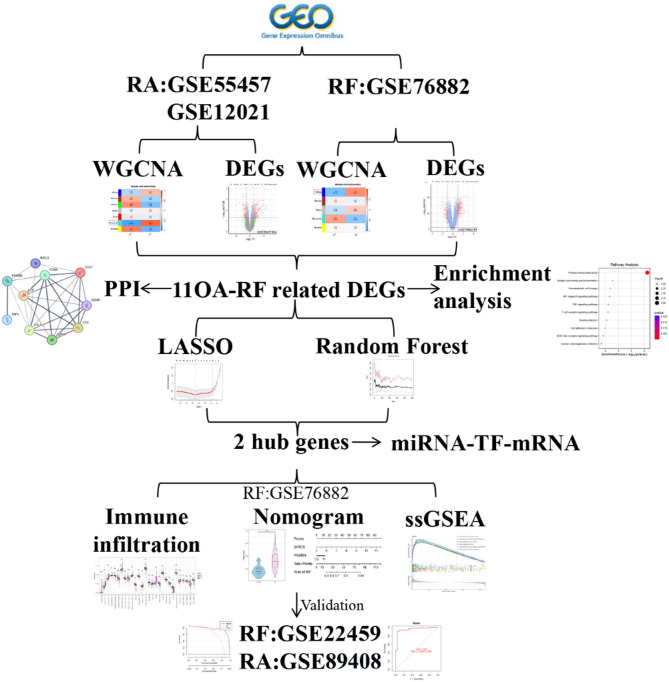
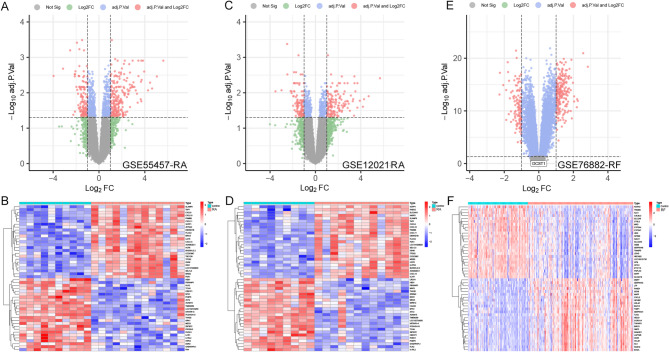
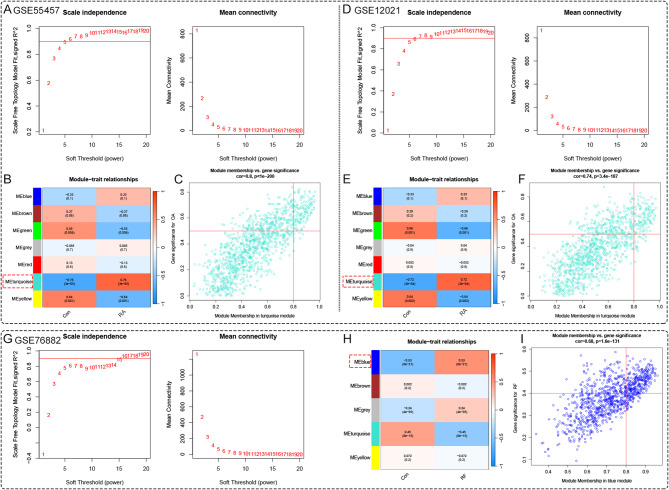
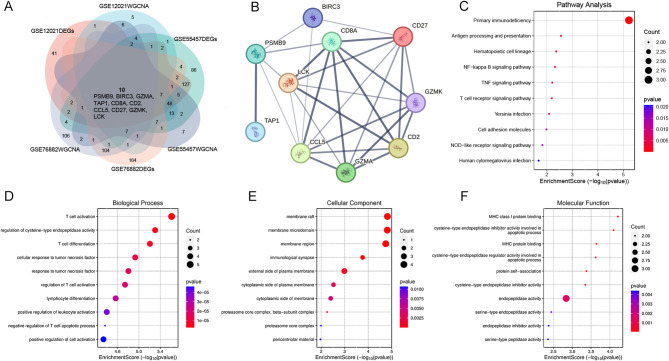
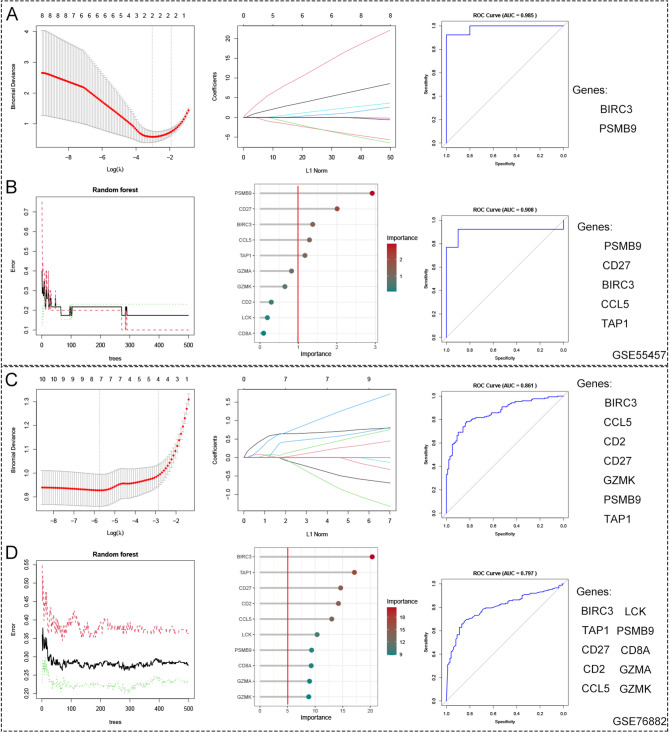
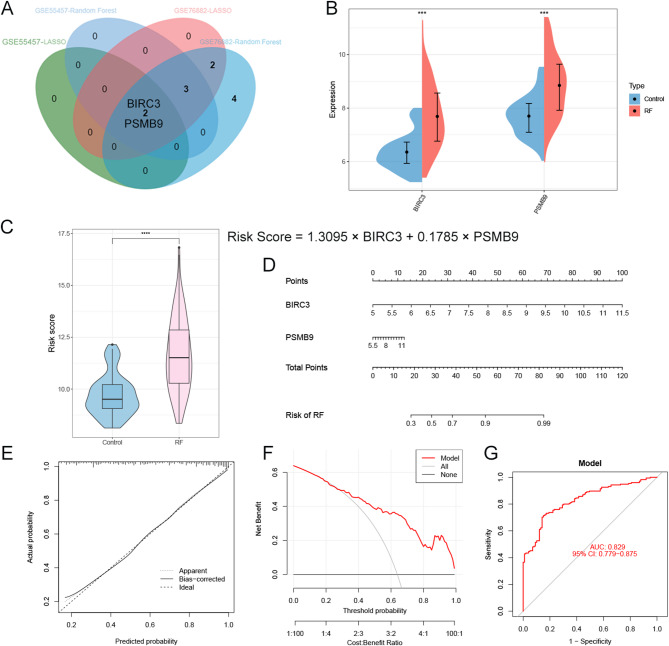
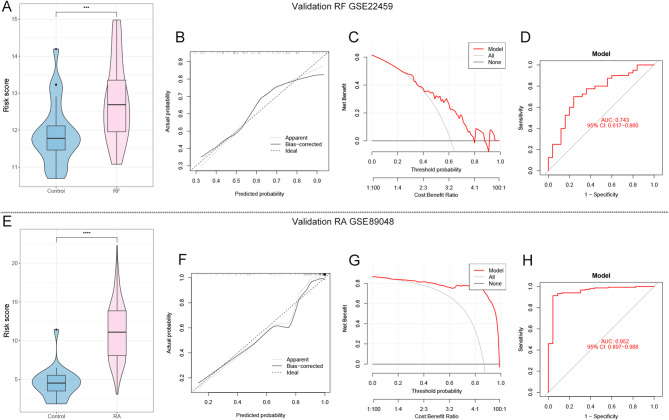
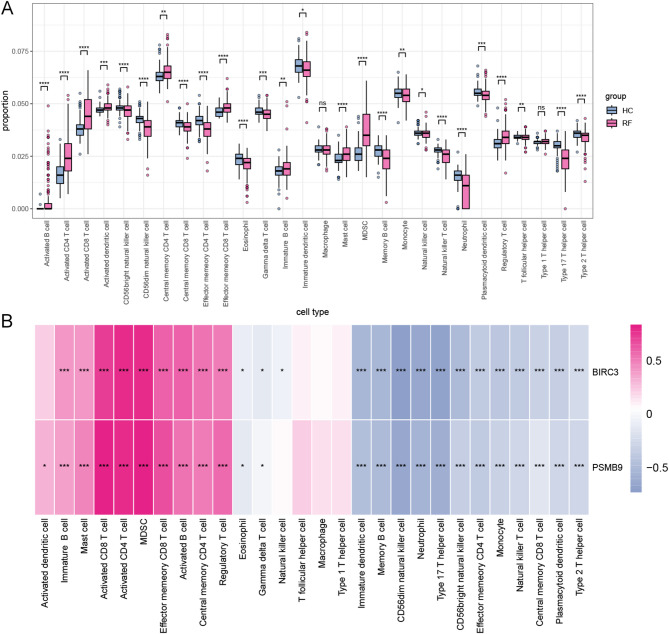
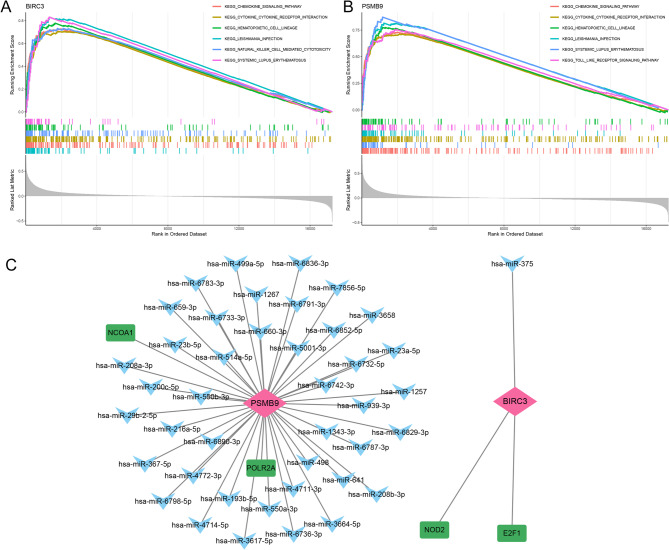
This study aimed to identify the potential pathogenic genes associated with the comorbidity of rheumatoid arthritis (RA) and renal fibrosis (RF). Transcriptomic data related to RA and RF were retrieved from the GEO database. Differential expression gene analysis (DEGs) and weighted gene co-expression network analysis (WGCNA) were carried out to identify the RA-RF-DEGs. Subsequently, functional enrichment analysis was performed to clarify the biological functions of these genes. Machine learning algorithms were used to screen for the hub RA-RF differential expression genes, and then a Logistic Regression (LR) model was constructed. The accuracy of the model was evaluated using the ROC curve. At the same time, single-sample gene set enrichment analysis (ssGSEA) was applied to conduct immune infiltration analysis on the RF dataset. Gene set enrichment analysis (GSEA) was further performed on the hub genes to explore their underlying mechanisms in RF. Finally, a miRNA-TF-mRNA regulatory network centered around the hub genes was constructed.The results showed that 10 RA-RF-DEGs were identified through a comprehensive screening process. Enrichment analysis indicated that these differential expression genes were mainly involved in inflammatory responses and immune regulation. Subsequently, two hub genes, namely BIRC3 and PSMB9, were identified. A LR model was developed, and its predictive accuracy was verified using the ROC curve derived from an external independent dataset. Immune infiltration analysis revealed a significant correlation between the two hub genes and immune dysregulation in RF. Gene set enrichment analysis (GSEA) clarified the potential biological pathways through which BIRC3 and PSMB9 might function in RF. The constructed miRNA-TF-mRNA regulatory network provided a comprehensive overview of the post-transcriptional and transcriptional regulatory mechanisms. In conclusion, this study identified two candidate risk genes for RA-RF, providing new insights for the early diagnosis and treatment of RA complicated with RF.

Keywords: Immune infiltration; Machine learning; Renal fibrosis; Rheumatoid arthritis; Risk model.


Conflict of interest statement

Competing interests: The authors declare no competing interests.

Figures

Fig. 1
Fig. 1
The flowchart of this study.
Fig. 2
Fig. 2
Identification of the DEGs in RA and RF. (A) A volcano map illustrating the DEGs in RA patients compared to healthy controls (GSE55457). (B) heatmap of the top 25 upregulated and downregulated DEGs (GSE55457). (C) A volcano map illustrating the DEGs in RA patients compared to healthy controls (GSE12021). (B) heatmap of the top 25 upregulated and downregulated DEGs (GSE12021). (E) A volcano map illustrating the DEGs in RF patients compared to healthy controls (GSE76882). (B) heatmap of the top 25 upregulated and downregulated DEGs (GSE76882).
Fig. 3
Fig. 3
WGCNA. (A, D) Determine the best soft threshold. The soft threshold value of 5 was determined as the optimal choice for constructing a scale-free network based on the position of the redline (R²=0.9).(B, E) Correlations between different modules and clinical traits(RA). The turquoise module has the highest correlation with RA. (C, F) Scatterplot of correlations between gene significance (GS) > 0.5 and module membership (MM) > 0.8 in the blue module. ABC corresponds to the RA dataset GSE55457, while DEF refers to the RA dataset GSE12021.(G) Determine the best soft threshold. The soft threshold value of 15 was determined as the optimal choice for constructing a scale-free network based on the position of the redline (R²=0.9).(H)Correlations between different modules and clinical traits(RF), the blue module has the highest correlation with RF.(I) Scatterplot of correlations between GS > 0.4 and MM > 0.8 in the blue module.
Fig. 4
Fig. 4
PPI and fnctional enrichment analysis of RA-RF-DEGs. (A) A Venn diagram of the DEGs and WGCNA module genes identifying 11 RA-RF-DEGs. (B) PPI network of RA-RF-DEGs. (C) Bubble plots showing the top 10 results of KEGG enrichment analysis and GO enrichment analysis with (D) BP, (E) CC, and (F) MF.
Fig. 5
Fig. 5
Machine Learning Screening hub RA-RF-DEGs. (A) LASSO coefficient analysis identifies the optimal lambda marked by vertical dashed lines. This determination is based on five cross-validations of adjustment parameters, and the ROC curve is also provided for evaluation(GSE55457). (B) The relationship between the number of random forest trees and the error rate is explored, along with the ranking of RA-RF-DEGs based on their relative importance(importance > 1), and the ROC curve is also provided for evaluation(RA: GSE55457). (C) LASSO coefficient analysis identifies the optimal lambda marked by vertical dashed lines. This determination is based on five cross-validations of adjustment parameters, and the ROC curve is also provided for evaluation(RF: GSE76882). (D) The relationship between the number of random forest trees and the error rate is explored, along with the ranking of RA-RF-DEGs based on their relative importance(importance > 5), and the ROC curve is also provided for evaluation(RF: GSE76882).
Fig. 6
Fig. 6
A nomogram designed for RF. (A) A Venn diagram of the LASSO and RF features identifying two hub RA-RF-DEGs. Violin plots show hub PRG-DEGs expression in control and RF tissues in (B) training set GSE76882.(C) Risk distribution in the training set between RF patients and healthy controls. (D) A nomogram presents the risk distribution within the training set. (E) shows a calibration curve, which evaluates the predictive accuracy of the nomogram for the training set. (F) employs DCA to assess the clinical utility of the nomogram for the training set. Additionally, ROC curves are utilized to evaluate the diagnostic performance of the LR model in the (G) training set. ***P < 0.001;****P < 0.0001.
Fig. 7
Fig. 7
Verification of diagnostic efficacy of model in the test set. (A) Risk distribution of RF and healthy control group in the RF test set. (B) Use calibration curves to evaluate the predictive ability of the model in the RF test set. (C) DCA evaluates the clinical benefits of the model for the RF test set. (D) ROC curve evaluates the diagnostic efficacy of the model in the RF test set. (E) Risk distribution of RA and healthy control group in the RA test set. (F) Use calibration curves to evaluate the predictive ability of the model in the RA test set. (G) DCA evaluates the clinical benefits of the model for the RA test set. (H) ROC curve evaluates the diagnostic efficacy of the model in the RA test set. ***P < 0.001;****P < 0.0001.
Fig. 8
Fig. 8
The immune characteristics in the RF. (A) Boxplot showing the variations in immune cell distribution in the RF patients compared to controls. (B) Correlation analysis between BIRC3 ,PSMB9 and infiltrating immune cells in RF.*p < 0.05; **p < 0.01; ***p < 0.001.
Fig. 9
Fig. 9
GSEA and regulatory networks of hub RA-RF-DEGs. The correlation of (A) BIRC3, (B) PSMB9 with the top six significantly enriched pathways. (C) A diagram representing the miRNA-TF-RNA regulatory network. Pink diamond signifies genes, blue V-shapes represent miRNAs, and green squares denote TFs.

Similar articles

References

    1. Zhang, T. et al. Spectrum and prognosis of renal histopathological lesions in 56 Chinese patients with rheumatoid arthritis with renal involvement. Clin. Exp. Med.20, 191–197. 10.1007/s10238-019-00602-6 (2020). - PubMed
    1. Figus, F. A., Piga, M., Azzolin, I., McConnell, R. & Iagnocco, A. Rheumatoid arthritis: extra-articular manifestations and comorbidities. Autoimmun. Rev.20, 102776. 10.1016/j.autrev.2021.102776 (2021). - PubMed
    1. Ponticelli, C., Doria, A. & Moroni, G. Renal disorders in rheumatologic diseases: the spectrum is changing (part 2. Arthridides). J. Nephrol.34, 1081–1090. 10.1007/s40620-020-00776-3 (2021). - PubMed
    1. Couderc, M. et al. Prevalence of renal impairment in patients with rheumatoid arthritis: results from a Cross-Sectional multicenter study. Arthritis Care Res. (Hoboken)68, 638–644. 10.1002/acr.22713 (2016). - PubMed
    1. Hickson, L. J., Crowson, C. S., Gabriel, S. E., McCarthy, J. T. & Matteson, E. L. Development of reduced kidney function in rheumatoid arthritis. Am. J. Kidney Dis.63, 206–213. 10.1053/j.ajkd.2013.08.010 (2014). - PMC - PubMed