. 2025 Jul 1;15(1):21462.
doi: 10.1038/s41598-025-06268-3.

Analysis of molecular and cellular bases of honey bee mushroom body development

Affiliations

Analysis of molecular and cellular bases of honey bee mushroom body development

Shuichi Kamata et al. Sci Rep. .

Abstract

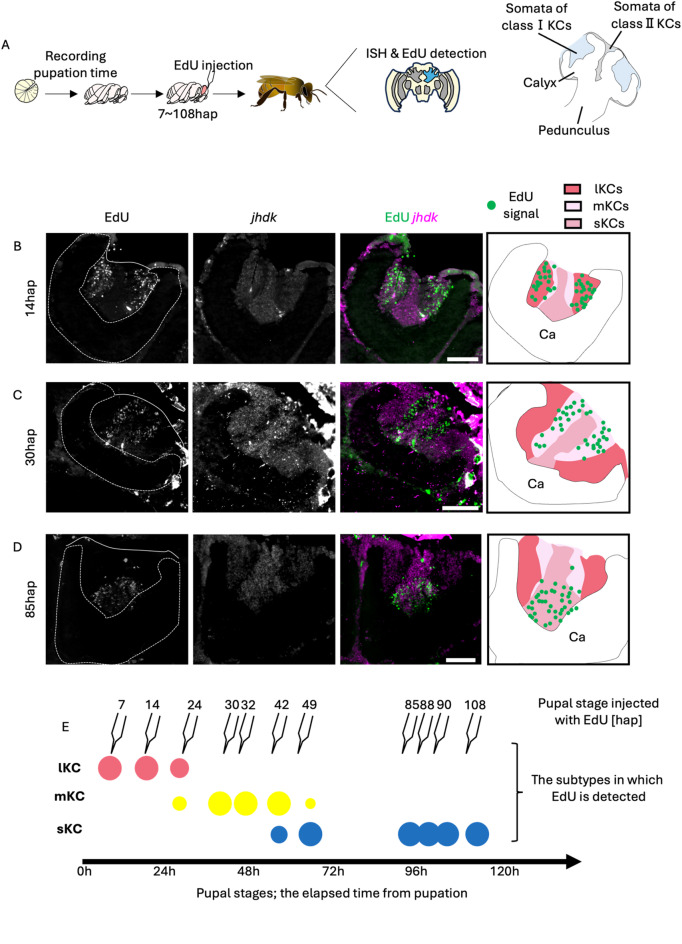
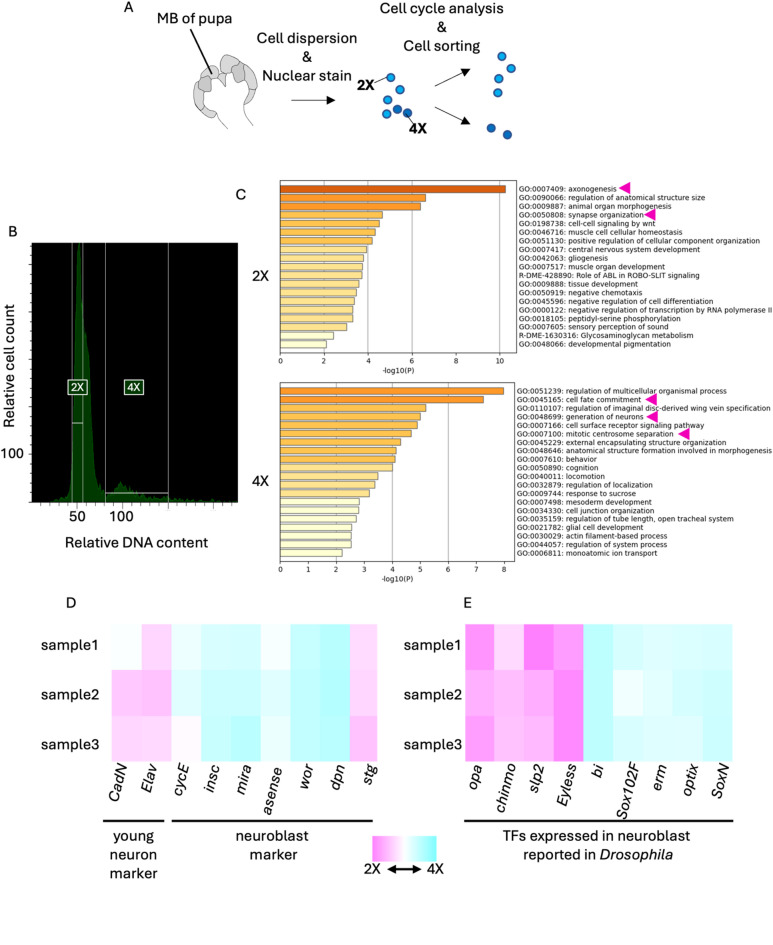
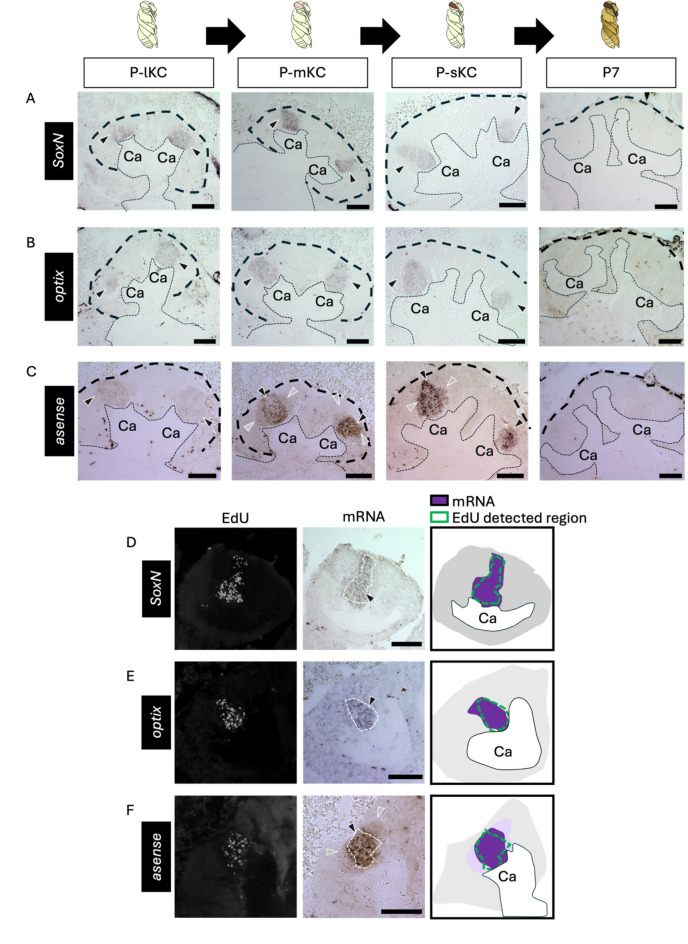
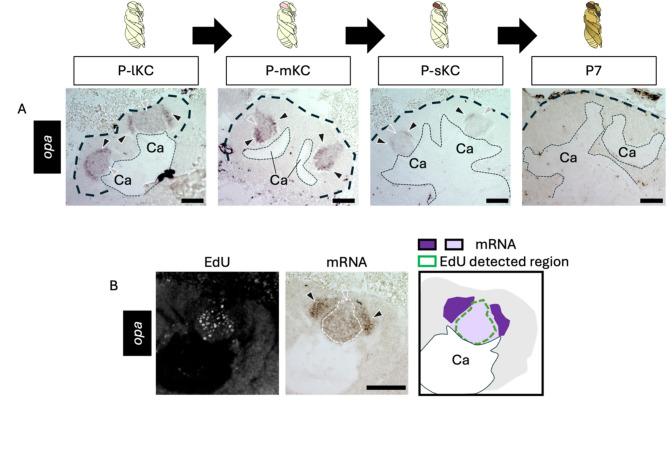
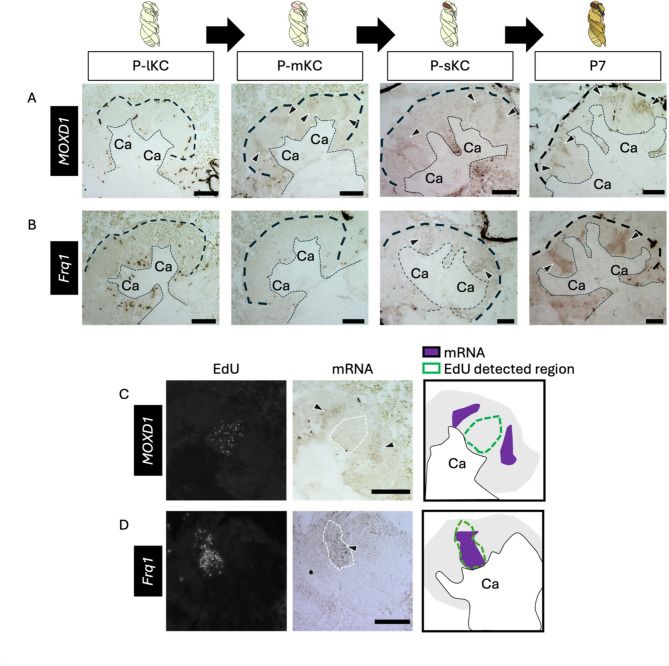
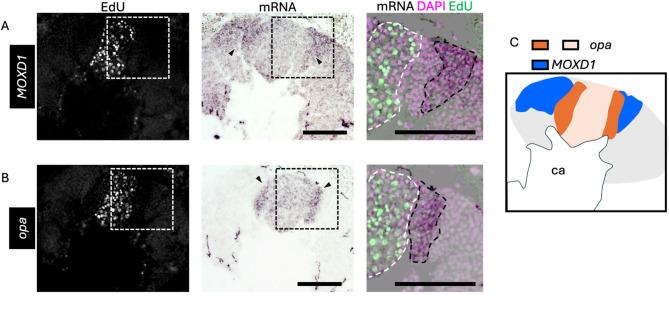
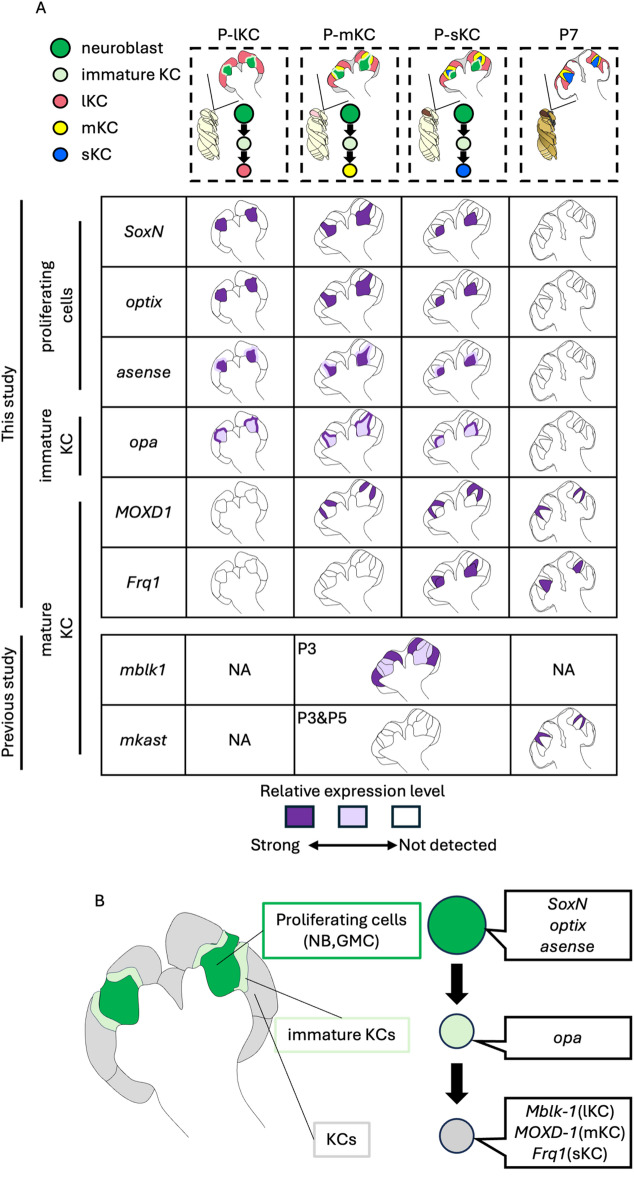
In the honey bee, mushroom bodies (MBs), a higher-order center of the insect brain, comprise three class I Kenyon cell (KC) subtypes (lKC, mKC, and sKC) with distinct somata sizes and locations and gene expression profiles. While these KC subtypes have been suggested to function in different behavioral regulations, the molecular and cellular basis of their development remains obscure. Here, we showed that lKCs, mKCs, and sKCs are produced in that order at different pupal stages by labeling proliferating MB cells with 5-ethynil-2'-deoxyuridine at various pupal stages. RNA-sequencing analysis of FACS-sorted pupal MB cells identified genes that were upregulated in proliferating and non-proliferating MB cells, respectively. Furthermore, in situ hybridization of some of these genes labeled the proliferating cells or immature KCs in the MBs at pupal stages producing each subtype. We found that the expression patterns of SoxNeuro, optix, and asense were consistent with those in Drosophila MBs, while odd-paired, which functions in neuroblasts in Drosophila, was preferentially expressed in immature KCs in honey bees. Our findings revealed the basic scheme of the molecular and cellular processes of honey bee MB development and suggested that they are at least partially different from those of Drosophila MB development.


Conflict of interest statement

Declarations. Competing interests: The authors declare no competing interests.

Figures

Fig. 1
Fig. 1
Identification of the pupal stage when each subtype is produced from neuroblasts. (A) A scheme of the experimental design. Last instar larvae were collected from the bee hives and EdU was injected into the pupal heads at various pupal stages. After emergence, EdU detection and ISH in the brain sections were performed. Schematic diagram of a honey bee MB (the region filled with blue in the brain schematic) is shown on the right. (B-D) Distribution of EdU signals in the brain of adult individuals injected with EdU at 14hap (B), 30hap (C), and 85hap (D). From left to right panels, the EdU signals, jhdk FISH signals, merged signals, and schematic diagrams of EdU signals and each subtype are shown. Ca, a calyx in the MB. Scale bar; 100 μm. (E) Correspondence between the pupal stage injected with EdU and the subtypes where EdU signals were detected. The size of each circle represents the approximate proportion of EdU-detected cells in each subtype.
Fig. 2
Fig. 2
RNA-seq analysis of 2X and 4X cell fractions in the pupal MBs sorted by FACS. (A) A scheme of experimental design. MBs were dissected from pupae at P-lKC stages. After cell dispersion and nuclear staining with Hoechst33342, both the 2X and 4X fractions were sorted using FACS. (B) Cell cycle analysis of dispersed pupal MB cells. The ranges of relative DNA content (the intensity of Hoechst33342) of cells sorted as the 2X or 4X fraction are indicated with white lines. (C) The results of GO enrichment analysis using DEGs in each fraction by Metascape. Magenta arrows indicate the GO terms mentioned in the text. (D, E) Heatmap showing the relative expression levels of marker genes of young neurons or neuroblasts (D) and genes coding transcription factors (TFs) reported to be expressed in neuroblasts in Drosophila (E). The relative values are calculated for each sample by comparing the expression levels of genes in the 2X and 4X fractions. Magenta and blue show that expression levels are higher in the 2X and 4X fractions, respectively.
Fig. 3
Fig. 3
ISH of the genes suggested to be expressed in the proliferating cells in the pupal MBs. (A-C) The results of ISH of SoxN (A), optix (B), and asense (C) in the MBs of pupae at P-lKC stage, P-mKC stage, P-sKC stage, and P7 pupal stage, respectively. The thin and bold black dashed lines indicate the calyces and areas of KC somata, respectively. (D-E) The results of EdU detection and ISH of SoxN (D), optix (E), and asense (F) using the pupae with MB proliferating cells injected with EdU 2 h before dissection. From left to right panels, the EdU signals, ISH signals, and schematic diagrams of EdU and ISH signals are shown. The white dashed lines in ISH images indicate the region where EdU signals were detected. The intensity of the purple color in schematic diagrams represents the differences in the intensity of ISH signals. Black and gray arrowheads indicate strong and weak ISH signals, respectively. The images in panels A−C include both lateral and medial calyces of the pupal MB, while images and schematics in panels D−F include only one calyx of the pupal MB. Ca, a calyx in the MB. Scale bar; 100 μm.
Fig. 4
Fig. 4
ISH of opa in the pupal MBs. (A) The results of ISH of opa in the MBs of pupae at P-lKC stage, P-mKC stage, P-sKC stage, and P7 pupal stage, respectively. The thin and bold black dashed lines indicate the calyces and areas of KC somata, respectively. (B) The results of EdU detection and ISH of opa using the pupae with MB proliferating cells injected with EdU 2 h before dissection. From left to right panels, the EdU signals, ISH signals, and the schematic diagram of EdU and ISH signals are shown. The white dashed line in the ISH image indicates the region where EdU signals were detected. The intensity of the purple color in the schematic diagram represents the differences in the intensity of ISH signals. Black and gray arrowheads indicate strong and weak ISH signals, respectively. Ca, a calyx in the MB. Scale bar; 100 μm.
Fig. 5
Fig. 5
ISH of the genes suggested to be expressed in the mature KCs in the pupal MBs. (A, B) The results of ISH of MOXD1 (A) and Frq1 (B) in the MBs of pupae at P-lKC stage, P-mKC stage, P-sKC stage, and P7 pupal stage, respectively. The thin and bold black dashed lines indicate the calyces and region of KC somata, respectively. (C, D) The results of EdU detection and ISH of MOXD1 (C) and Frq1 (D) using the pupae at P-mKC stage (C) and P-sKC stage (D) injected with EdU 2 h before dissection. From left to right panels, the EdU signals, ISH signals, and schematic diagrams of EdU and ISH signals are shown. The white dashed lines in ISH images indicate the region where EdU signals were detected. Black arrowheads indicate ISH signals. Ca, a calyx in the MB. Scale bar; 100 μm.
Fig. 6
Fig. 6
ISH of opa and MOXD1 using serial sections of the pupal MBs. (A, B) The results of ISH of MOXD1 (A) and opa (B) with serial sections of the MBs of pupae at P-mKC stage injected with EdU 2 h before dissection. From left to right panels, merged images of DAPI and EdU signals, ISH signals, and magnified views of the merged images of DAPI, EdU, and ISH signals in the squares surrounded with white dushed lines are shown. Black arrowheads in the middle panels indicate strong ISH signals. Areas surrounded by black and white dashed lines in the right panels indicate areas with strong ISH signals and those with EdU signals, respectively. (C) The schematic diagrams of the expression pattern of opa (dark and light orange) and MOXD1 (blue). Ca, a calyx in the MB. Scale bar; 100 μm.
Fig. 7
Fig. 7
The molecular and cellular developmental basis of class I KCs in the honey bee. (A) Summary of gene expression patterns in the MBs at 4 pupal stages (P-lKC stage, P-mKC stage, P-sKC stage and P7). The intensity of the purple color in each schematic diagram represents the differences in the expression level of each gene. In the previous studies,,, ISH of Mblk-1 and mKast was performed in pupae at P3 and at P3, P5, and P7, respectively. NA: not analyzed in the previous studies. (B) The differentiation trajectory of KCs from proliferating cells in the honey bee pupal MBs including genes specifically expressed in each cell type.

Similar articles

References

    1. Seeley, T. D. Honey bee ecology: A study of adaptation in social life (Princeton University Press, 2014).
    1. von Frisch, K. The Dance Language and Orientation of Bees (Harvard University Press, 1967).
    1. Johnson, B. R. Within-nest temporal polyethism in the honey bee. Behav. Ecol. Sociobiol.62, 777–784. 10.1007/s00265-007-0503-2 (2008).
    1. Heisenberg, M. Pattern recognition in insects. Curr. Opin. Neurobiol. 5, 475–481. 10.1016/0959-4388(95)80008-5 (1995). - PubMed
    1. Menzel, R. et al. The knowledge base of bee navigation. J. Exp. Biol.199, 141–146. 10.1242/jeb.199.1.141 (1996). - PubMed

Substances

LinkOut - more resources