. 2025 Jul 1;15(1):21559.
doi: 10.1038/s41598-025-07647-6.

Development and validation of a predictive model for continuous renal replacement therapy in sepsis patients using the MIMIC-IV database

Affiliations

Development and validation of a predictive model for continuous renal replacement therapy in sepsis patients using the MIMIC-IV database

Binglin Song et al. Sci Rep. .

Abstract

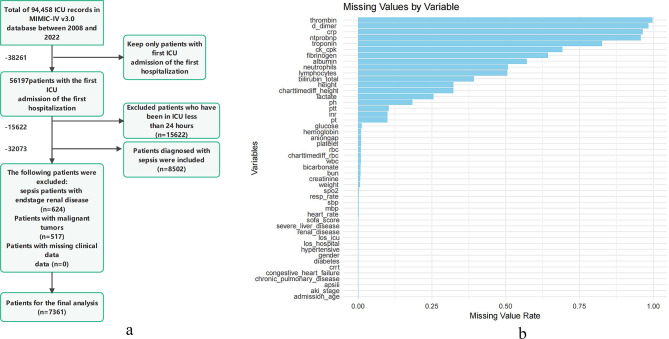
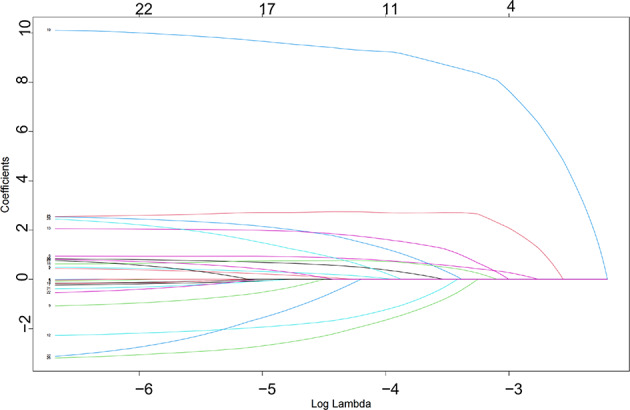
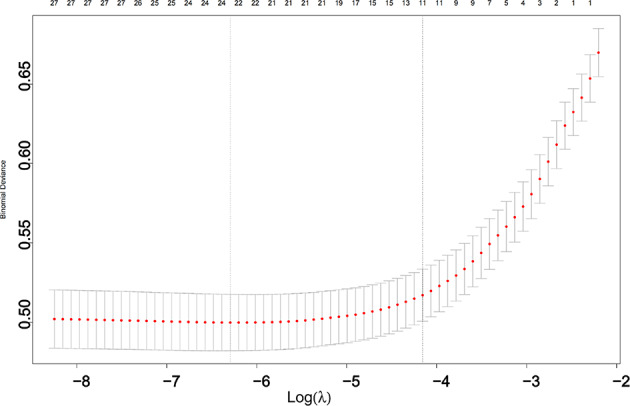
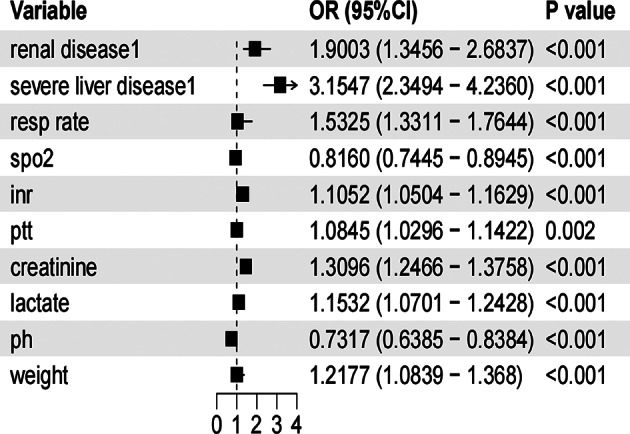
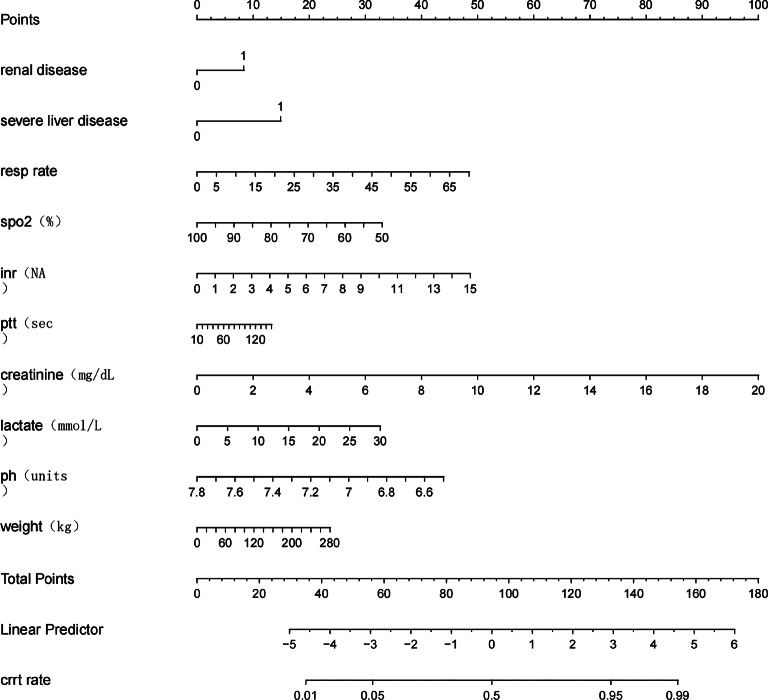
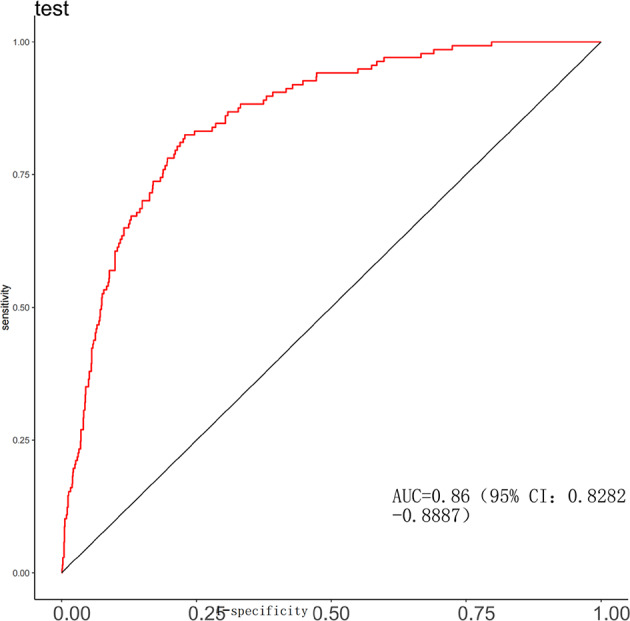
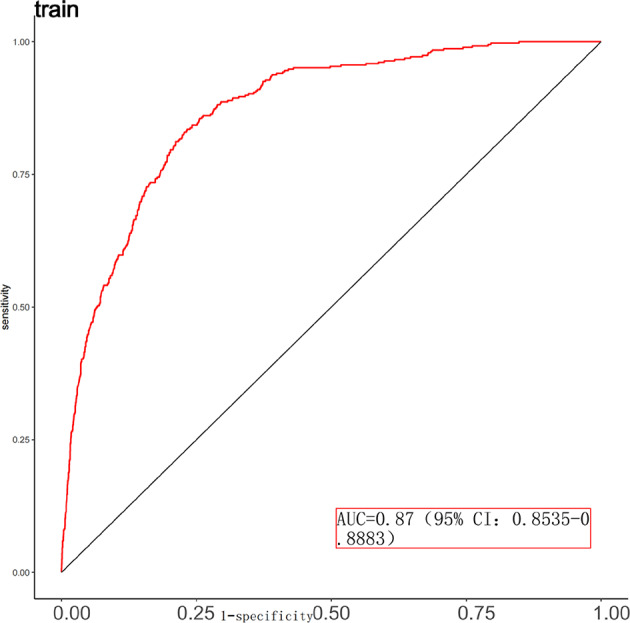
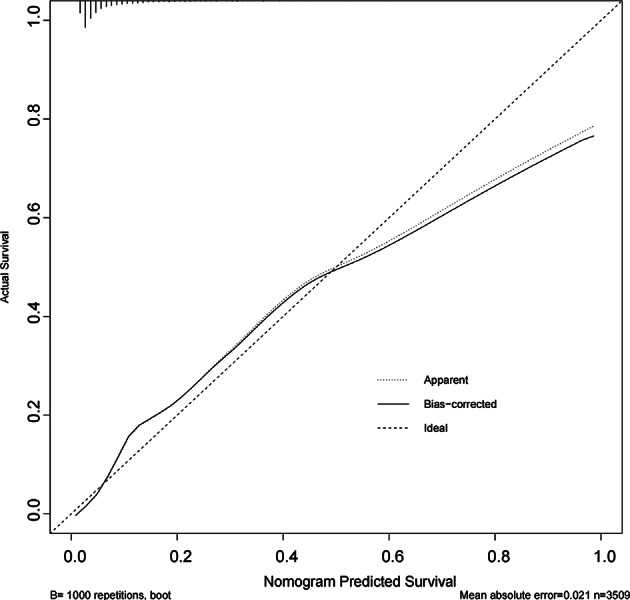
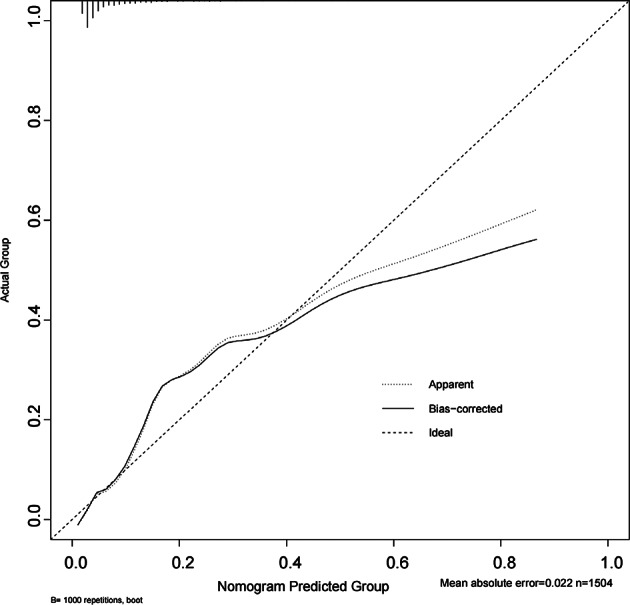
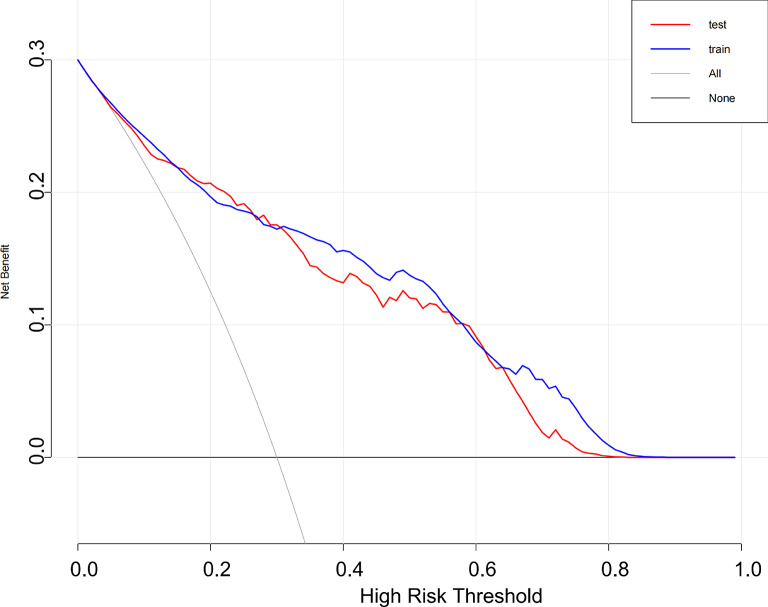
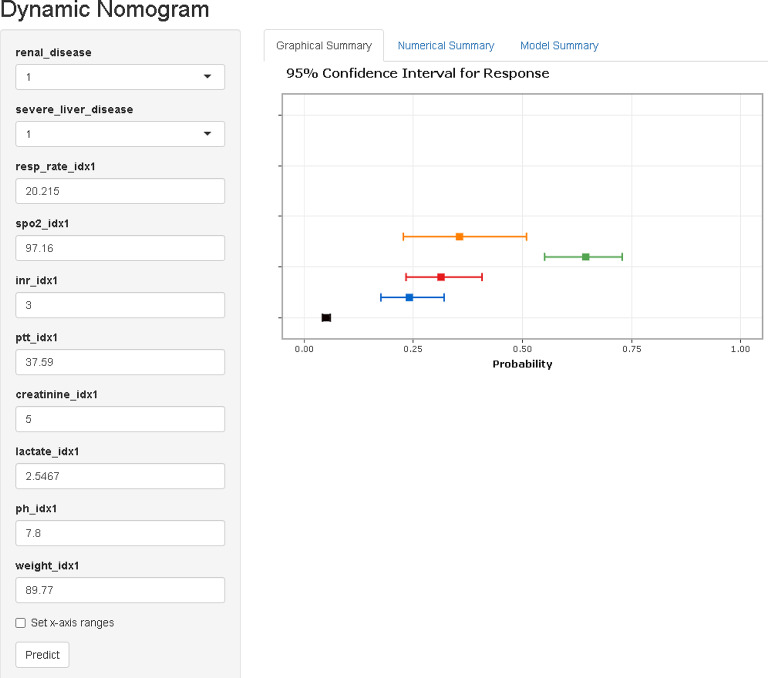
To develop and validate a dynamic nomogram for predicting the need for continuous renal replacement therapy (CRRT) in septic patients in the intensive care unit (ICU). Data were extracted from the MIMIC-IV 3.0 database and divided into a training set and a validation set in a 7:3 ratio. Relevant risk factors were identified through LASSO regression, and a binary logistic regression model was subsequently developed. The CRRT risk nomogram was visualized using R language, with the DynNom package employed to create a dynamic nomogram. Model performance was assessed using the area under the receiver operating characteristic curve (AUC), Harrell's C-index, and calibration curves. The clinical utility of the model was evaluated via decision curve analysis (DCA). A total of 7361 septic patients were included in this study, of which 525 required CRRT. The study identified several predictive factors for CRRT, including respiratory rate, oxygen saturation, international normalized ratio (INR), activated partial thromboplastin time (APTT), creatinine, lactate, pH, body weight, renal disease, and severe liver disease. The C-index was 0.871. The AUCs for the training and validation sets were 0.87 (95% CI: 0.8535-0.8883) and 0.86 (95% CI: 0.8282-0.8887), respectively. The calibration curves demonstrated good predictive consistency. DCA confirmed the model's significant clinical value. The dynamic nomogram is available for visualization at: https://zhong-hua-min-zu-wan-sui.shinyapps.io/CRRT_prediction_nomogram/ . We have developed a dynamic nomogram based on the MIMIC-IV database, incorporating 10 clinical features, to predict the probability of CRRT requirement in septic patients. Internal validation showed that this model exhibits robust predictive performance.

Keywords: Continuous renal replacement therapy; Dynamic nomogram; Intensive care unit; Prediction; Sepsis.


Conflict of interest statement

Declarations. Competing interests: The authors declare no competing interests. Ethical approval: Due to the retrospective nature of this study and the de-identified, publicly accessible MIMIC-IV database, the Institutional Review Board (IRB) at the Massachusetts Institute of Technology (MIT) waived the requirement for informed consent. Additionally, since the data is de-identified and publicly available, no additional ethical approval is required for the use of MIMIC-IV data in China.

Figures

Fig. 1
Fig. 1
(a) Flow chart of data screening (Flow diagram illustrating the selection process of ICU patients from the MIMIC-IV v3.0 database (2008–2022). A total of 94,458 ICU records were screened. Patients were included if they were admitted to the ICU for the first time during their first hospitalization and stayed for at least 24 h. Further exclusions were applied for end-stage renal disease, malignancy, or missing clinical data. After these criteria, 7361 septic patients were included in the final analysis). (b) Missing Data Proportions of Candidate Predictors for CRRT Prediction Modeling (Missing data proportions for all candidate clinical, demographic, and laboratory variables. Variables such as thrombin, D-dimer, and CRP exhibited high missingness, with rates exceeding 90%. In contrast, core demographic variables (e.g., age, gender) and key clinical indicators (e.g., blood pressure, creatinine, comorbidities) had minimal or no missing values).
Fig. 2
Fig. 2
ROC curves of individual predictors for CRRT requirement. (Receiver operating characteristic (ROC) curves for individual clinical and laboratory variables in predicting the requirement for continuous renal replacement therapy (CRRT). Each curve represents the discriminatory performance of a single variable, with sensitivity plotted against 1-specificity. Variables such as PT, INR, creatinine, and spo2 demonstrated relatively higher predictive performance compared to others. The proximity of most curves to the diagonal suggests that individual predictors alone may have limited discriminative power).
Fig. 3
Fig. 3
Correlation Matrix of Key Predictive Variables(Correlation matrix displaying the pairwise Pearson correlations among variables used in the predictive modeling. Color intensity and circle size represent the strength and direction of correlation. Blue indicates positive and red indicates negative correlations. Statistical significance is marked with asterisks (*p < 0.05; **p < 0.01; ***p < 0.001). The figure includes both continuous and binary variables, the latter encoded as 0 and 1 for analysis).
Fig. 4
Fig. 4
LASSO coefficient profiles of candidate predictors (Coefficient profiles of candidate predictors plotted against the log-transformed lambda values in the LASSO regression. Each curve represents the coefficient trajectory of a single variable. As the regularization parameter increases, more coefficients shrink toward zero, indicating variable exclusion. The numbers shown at the top of the plot correspond to the number of non-zero coefficients at each value of lambda).
Fig. 5
Fig. 5
Cross-validation curve for selecting the optimal lambda in LASSO regression (Ten-fold cross-validation results for tuning the regularization parameter (λ) in the LASSO regression. The horizontal axis shows the log-transformed values of λ, and the vertical axis indicates the corresponding mean cross-validated error. Red dots represent the average error at each λ, with grey error bars showing the standard deviation. The number of non-zero coefficients at each λ is indicated at the top of the plot.)
Fig. 6
Fig. 6
Forest plot of multivariable logistic regression for CRRT prediction (Forest plot displaying the odds ratios (OR), 95% confidence intervals (CI), and p-values from the multivariable logistic regression analysis. Variables such as severe liver disease, renal disease, and respiratory rate were associated with a significantly increased risk of requiring CRRT. OR values are visually represented by squares, and horizontal lines indicate 95% CI. P-values < 0.05 denote statistical significance.)
Fig. 7
Fig. 7
Nomogram for predicting the risk of CRRT requirement (Nomogram developed from a multivariable logistic regression model to predict the probability of requiring continuous renal replacement therapy (CRRT). Each predictor corresponds to a point scale at the top. To estimate a patient’s CRRT risk, locate each variable value on its corresponding axis, draw a vertical line upward to the “Points” scale to assign a score, then sum the total points and map them to the “CRRT rate” scale at the bottom. The nomogram facilitates individualized risk estimation at the bedside.)
Fig. 8
Fig. 8
Receiver operating characteristic (ROC) curve for the training set (ROC curve showing the discrimination performance of the predictive model in the training dataset. The model achieved an area under the curve (AUC) of 0.87 (95% CI: 0.8535–0.8883), indicating excellent ability to distinguish between patients who required CRRT and those who did not.)s.
Fig. 9
Fig. 9
Receiver operating characteristic (ROC) curve for the validation set. (ROC curve illustrating the discrimination performance of the predictive model in the validation dataset. The area under the curve (AUC) was 0.87 (95% CI: 0.8535–0.8883), indicating that the model maintained strong predictive accuracy in an independent dataset, consistent with its performance in the training set.)
Fig. 10
Fig. 10
Calibration curve for the training set. Calibration curve of the predictive model in the training dataset. The plot compares the predicted probabilities of CRRT with the actual outcomes. The solid line represents the bias-corrected performance estimated via 1000 bootstrap resamples, while the dotted line indicates the ideal calibration (perfect agreement between predicted and observed outcomes). The mean absolute error was 0.021, suggesting excellent agreement and minimal deviation from the ideal line.
Fig. 11
Fig. 11
Calibration curve for the validation set. Calibration curve of the predictive model in the validation dataset. The solid line represents the bias-corrected performance based on 1000 bootstrap resamples, while the dashed line indicates perfect calibration (ideal reference). The model’s predictions showed good agreement with observed outcomes across risk strata. The mean absolute error was 0.022, suggesting satisfactory calibration performance in the external validation set.
Fig. 12
Fig. 12
Decision curve analysis of the predictive model. (Decision curve analysis (DCA) showing the net clinical benefit of the predictive model across a range of threshold probabilities in both the training (blue) and validation (red) datasets. The gray lines represent the default strategies of treating all patients (“All”) and treating none (“None”). The model provided greater net benefit than either default strategy when the threshold probability was between approximately 0.05 and 0.65, demonstrating its potential utility in guiding clinical decision-making regarding CRRT initiation).
Fig. 13
Fig. 13
Web-based dynamic nomogram for predicting CRRT requirement. Screenshot of the online dynamic nomogram (available at: https://zhong-hua-min-zu-wan-sui.shinyapps.io/CRRT_prediction_nomogram/) for individualized prediction of CRRT requirement. Users can input patient-specific values for key predictors, including renal function, liver status, vital signs, and laboratory parameters. The graphical output presents the predicted probability along with the 95% confidence interval. This tool allows for real-time, user-friendly risk estimation at the bedside or in clinical decision-making systems.

Similar articles

References

    1. Peerapornratana, S., Manrique-Caballero, C. L., Gómez, H. & Kellum, J. A. Acute kidney injury from sepsis: current concepts, epidemiology, pathophysiology, prevention and treatment. Kidney Int.96, 1083–1099 (2019). - PMC - PubMed
    1. Zarbock, A., Gomez, H. & Kellum, J. A. Sepsis-induced acute kidney injury revisited: pathophysiology, prevention and future therapies. Curr. Opin. Crit. Care. 20, 588–595 (2014). - PMC - PubMed
    1. Bellomo, R., Baldwin, I., Ronco, C. & Kellum, J. A. ICU-based renal replacement therapy. Crit. Care Med.49, 406–418 (2021). - PubMed
    1. Cruz, M. G. et al. Septic versus non-septic acute kidney injury in critically ill patients: characteristics and clinical outcomes. Revista Brasileira De Terapia Intensiva. 26, 384–391 (2014). - PMC - PubMed
    1. Neri, M. et al. Nomenclature for renal replacement therapy in acute kidney injury: basic principles. Crit. Care Med.20, 1–11 (2016). - PMC - PubMed

Publication types

LinkOut - more resources