. 2025 Jul 1;15(1):20533.
doi: 10.1038/s41598-025-06051-4.

Regulatory T cells and matrix-producing cancer associated fibroblasts contribute on the immune resistance and progression of prognosis related tumor subtypes in ccRCC

Affiliations

Regulatory T cells and matrix-producing cancer associated fibroblasts contribute on the immune resistance and progression of prognosis related tumor subtypes in ccRCC

Chao Zhang et al. Sci Rep. .

Abstract

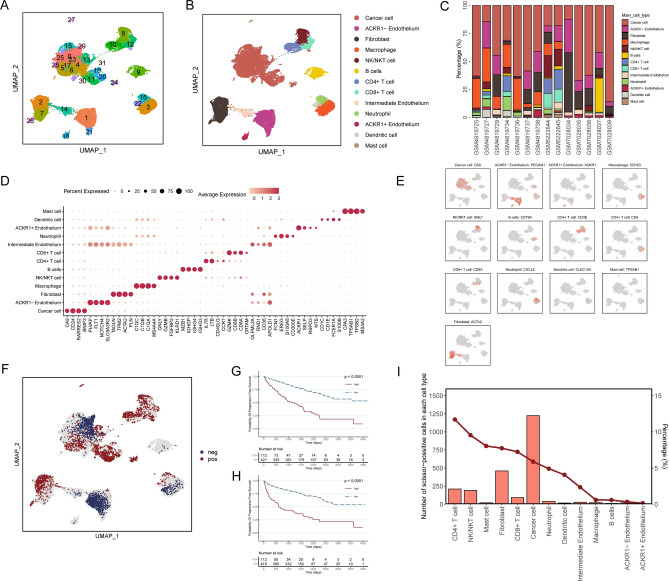
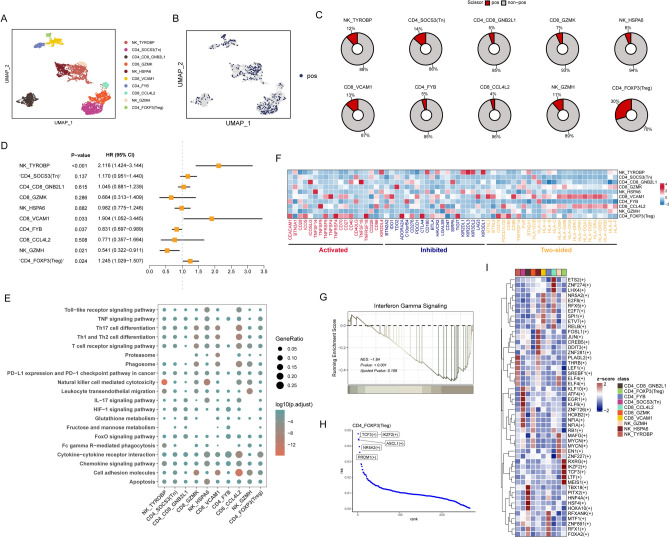
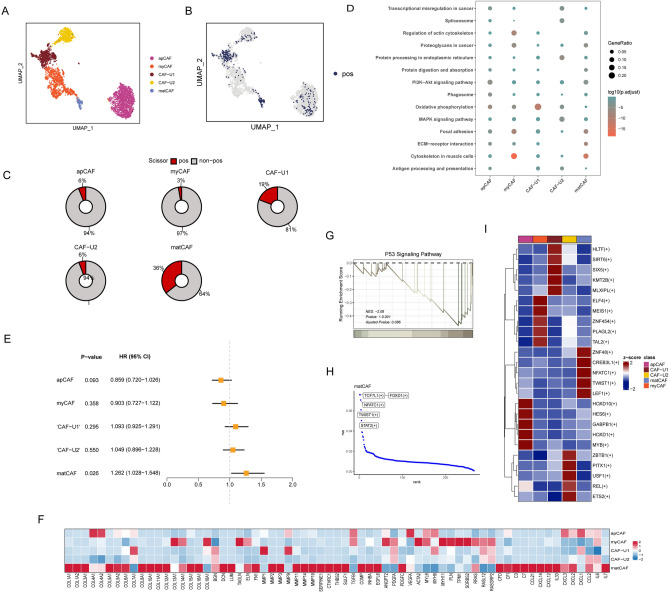
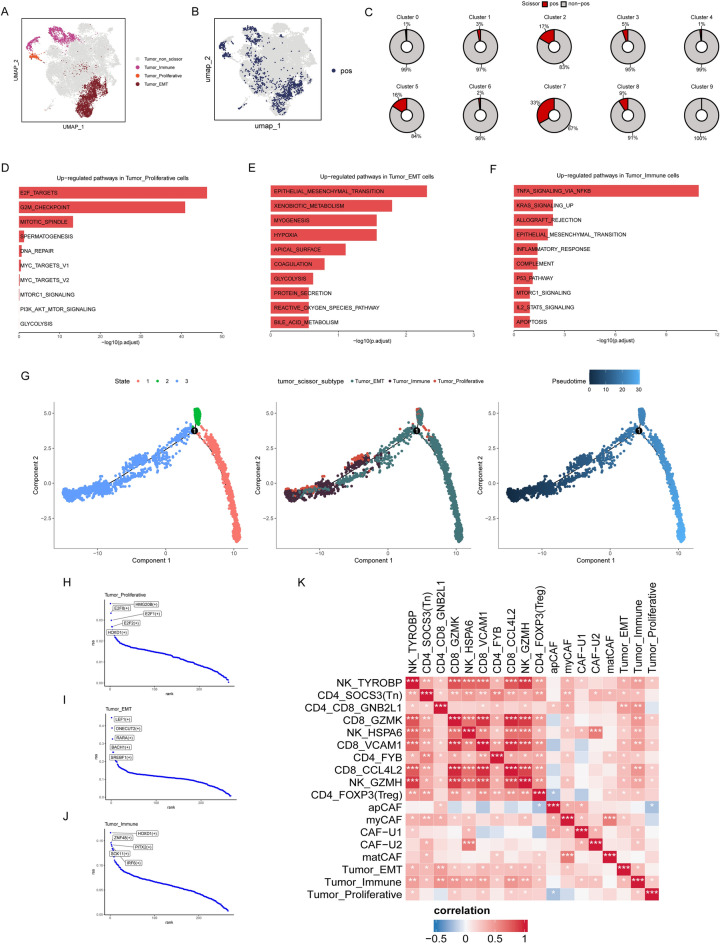
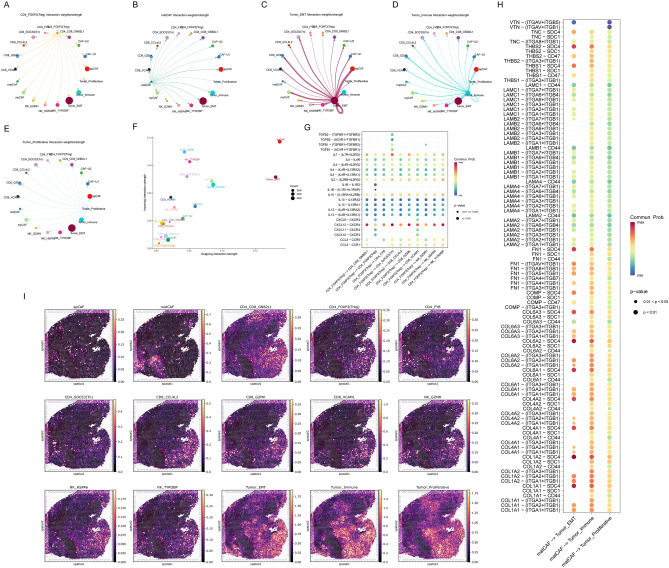
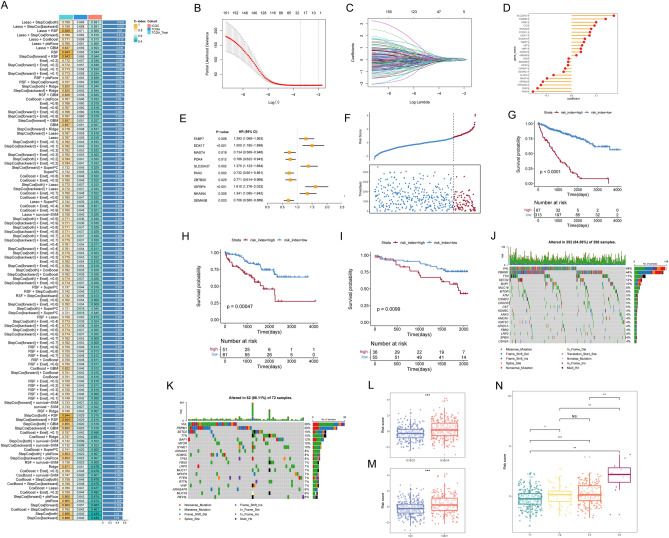
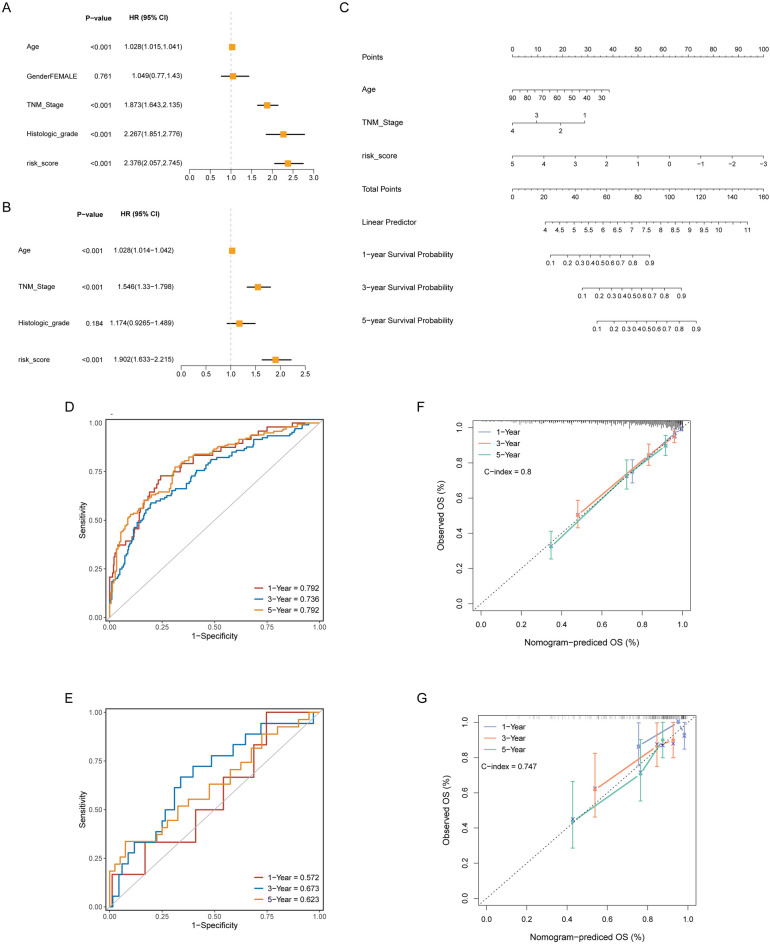
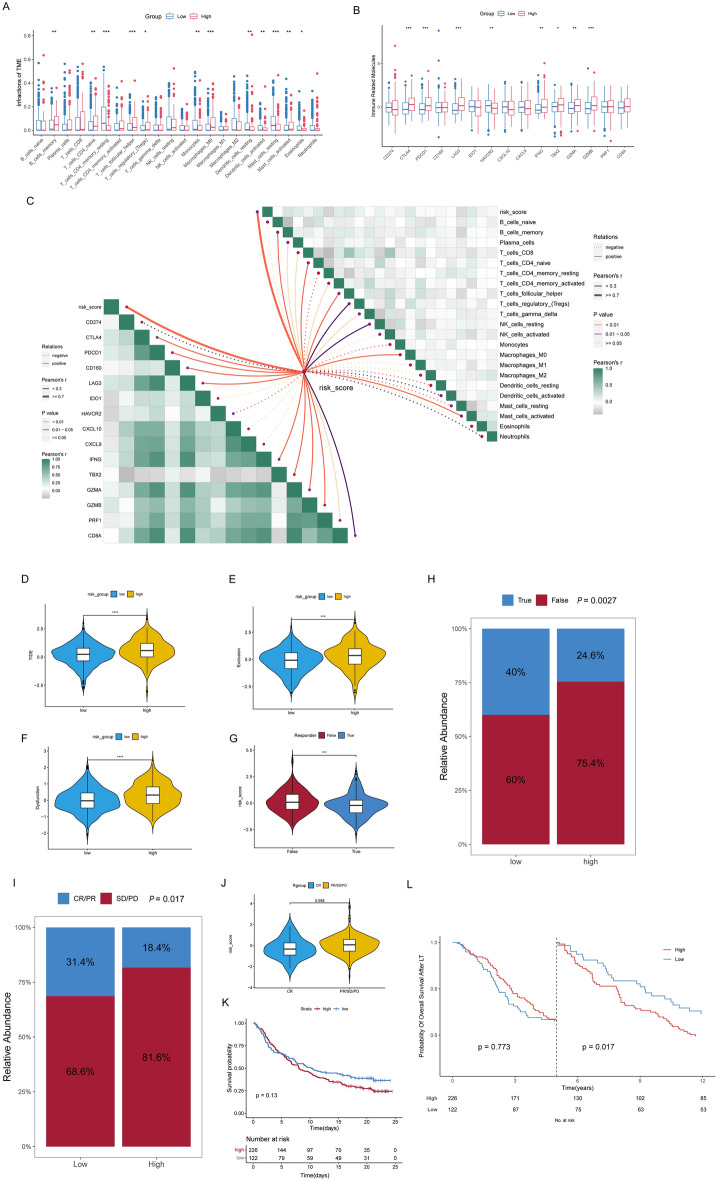
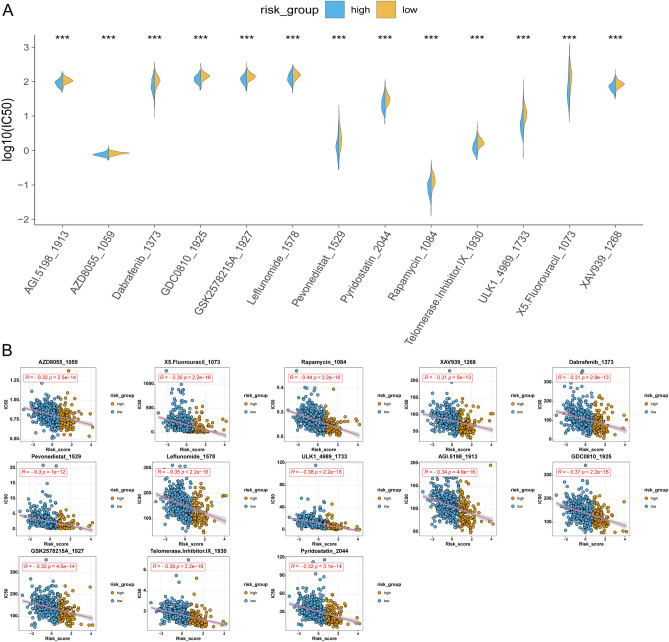
Clear cell renal cell carcinoma (ccRCC) is a prevalent malignant tumor in the field of urology. The effect of cell heterogeneity on the prognosis and reaction to treatment of ccRCC in large populations is still unclear. By analyzing public single cell RNA-sequencing and bulk RNA-sequencing data with the Scissor algorithm, we have identified three distinct prognosis related cancer cell subtypes which play an indispensable role on tumor metastasis, immune response and proliferation respectively. Besides, regulatory T cells (Tregs) and matrix producing cancer associated fibroblasts (matCAFs) were also recognized as crucial cell subtypes in the tumor microenvironment (TME). Moreover, potential interactions between Scissor + cells and other cells in TME were investigated to uncover regulatory mechanisms via 'Cell Chat' and cell2location algorithm. It is interesting that the interferon gamma signaling pathway and p53 signaling pathway contribute to the Scissor + transition of Tregs and matCAFs. The distinct activated transcription factor patterns were uncovered as well as the essential ligand-receptor pairs in the interactions among different cell subtypes, such as CXCL12-CXCR4 and COL6A2-SDC4. Then, we developed a risk score signature consisting of 10 genes, utilizing a 101-combination machine learning computational framework, which showed promising results in predicting the prognosis of patients. Furthermore, our study revealed variations in immune cell infiltration and the expression of immune related factors within the tumor microenvironment between different risk score groups, as well as the different sensitivity to the immunotherapy. In the end, we suggested Rapamycin as the additional therapy for the advanced ccRCC. In conclusion, our study created a signature to provide opportunities for predicting prognosis and improving treatments of ccRCC.

Keywords: Clear cell renal carcinoma; Machine learning; Multi-omics; Scissor.


Conflict of interest statement

Declarations. Competing interests: The authors declare no competing interests.

Figures

Fig. 1
Fig. 1
Integrated scRNA-seq analysis with Scissor algorithm identified heterogeneity among ccRCC patients and prognosis related cells. (A) UMAP plot for the 31 primary cell subclusters. (B) UMAP plot for the 13 defined cell clusters with known markers, including cancer cell, ACKR1- endothelium, fibroblast, macrophage, NK/NKT cell, B cell, CD4 + T cell, CD8 + T cell, intermediate endothelial cell, neutrophil, ACKR1 + endothelium, dendritic cell and mast cell. (C) The fraction of each cell clusters in each ccRCC sample. (D) Dot plot displays differentially gene expression in each cell cluster. (E) UMAP plot for the representative marker in each cell cluster. (F) Scissor algorithm reveals prognosis related cell types shown by UMAP plot. ‘pos’ means Scissor + and ‘neg’ means Scissor-. The other grey cells are not related with patients’ prognosis. (G) Kaplan–Meier curves of OS of high- and low-proportion of Scissor + cells groups in the TCGA training set. (H) Kaplan–Meier curves of PFI of high- and low-proportion of Scissor + cells groups in the TCGA training set. (I) The distribution of Scissor + cells in each cell clusters: histogram shows the absolute number of Scissor + cells; line graph shows the percentage of Scissor + cells.
Fig. 2
Fig. 2
The heterogeneity of T/NK cell subtypes in the TME influencing the prognosis of ccRCC. (A) 10 T/NK cell subtypes were shown by UMAP plot, including NK_TYROBP, CD4_SOCS3(Tn), CD4_CD8_GNB2L1, CD8_GZMK, NK_HSPA6, CD8_VCAM1, CD4_FYB, CD8_CCL4L2, NK_GZMH and CD4_FOXP3(Treg). (B) The distribution of Scissor + cells in T/NK cell subtypes were shown by UMAP plot. (C) The percentage of Scissor + cells and other cells in each cell subtypes. (D) Forest plot shows the relationship between each cell subtype and prognosis of ccRCC in the TCGA cohort. (E) Dot plot of functional enrichment for each cell subtypes based on the Hallmark pathway database. (F) Heatmap showed the main gene expression related to immune response of each cell subtype. Darker red indicates higher expression, and darker blue means lower expression. (G) Gene set enrichment analysis on Scissor + Treg cells. (H) Scatter plot shows the RSSs in Treg cells. (I) Heatmap showed the activated TFs determined by pySCENIC in each cell types. Darker brown indicates stronger activation, whereas darker blue corresponds to reduced activation.
Fig. 3
Fig. 3
The heterogeneity of CAF subtypes in the TME related to the prognosis of ccRCC. (A) 5 CAF subtypes were shown by UMAP plot, including apCAF, myCAF, CAF-U1, CAF-U2 and matCAF. (B) The distribution of Scissor + cells in CAF subtypes were shown by UMAP plot. (C) The percentage of Scissor + cells and other cells in each CAF subtypes. (D) Forest plot shows the relationship between each cell subtype and prognosis of ccRCC in the TCGA cohort. (E) Dot plot of functional enrichment for each CAF subtypes based on the Hallmark pathway database. (F) Heatmap showed the main expression of matrix-related genes of each cell subtype. Darker red indicates higher expression, and darker blue means lower expression. (G) Gene set enrichment analysis on Scissor + matCAFs. (H) Scatter plot shows the RSSs in matCAFs. (I) Heatmap showed the activated TFs determined by pySCENIC in each cell types. Darker brown indicates stronger activation, whereas darker blue corresponds to reduced activation.
Fig. 4
Fig. 4
Characteristics of the different types of Scissor + cancer cells and their relationship with other cells in the TME. (A) 3 main Scissor + cancer cell subtypes were shown by UMAP, including Tumor_Immune, Tumor_Proliferative, Tumor_EMT. (B) Scissor algorithm reveals prognosis related cancer cells shown by UMAP plot. (C) The percentage of Scissor + cells and other cells in each subclusters. (DF) Histogram of the hallmark pathway enrichment for ‘Tumor_Proliferative’, ‘Tumor_EMT’ and ‘Tumor_Immune’ cancer cell subtypes, respectively. (G) The developmental pseudotime trajectory among the three cancer cell subtypes. (HJ) Scatter plot shows the RSSs in ‘Tumor_Proliferative’, ‘Tumor_EMT’ and ‘Tumor_Immune’. (K) Heatmap shows the correlation among Scissor + cancer cell subtypes and other cells in the TME via CibersortX. Darker brown indicates more positive correlation, while darker blue means more negative correlation. *, p < 0.05; **, p < 0.01; ***, p < 0.001.
Fig. 5
Fig. 5
The interaction of 3 Scissor + cancer cell subtypes and other main cell subtypes in TME through CellChat and cell2location. (AE) Circle plot showing the interaction weights of one cell subtype with others, respectively (F) A scatter plot illustrated the disparities in incoming and outgoing interaction strengths among various cell types (G) Selected L-R interaction between Tregs and other immune cells were shown in the bubble plot. (H) Selected L-R interaction between 3 Scissor + cancer cell subtypes and matCAFs were shown in the bubble plot. (I) Spatial distribution of specific Scissor + cancer cell subtypes, T/NK cell subtypes and CAF subtypes via cell2location.
Fig. 6
Fig. 6
A risk score model was constructed via the machine learning-based procedure. (A) 101 kinds of predictive models were developed with their C-index across training and validation datasets. (B,C) In the training dataset, the optimal λ was determined when the partial likelihood deviance reached the minimum value. (D) Regression coefficients of genes derived from Lasso regression. (E) Forest plot shows hazard ratio of genes selected by stepCox. (F) The distribution of the risk score and overall survival status of patients in the training dataset. (GI) Kaplan–Meier curves of OS of high- and low-risk groups in the TCGA training set, TCGA internal validation set, and ICGC external validation dataset. (J,K) The mutational landscape of high- and low- risk group. (LN) The relationship between the risk score and clinical tumor characteristics.
Fig. 7
Fig. 7
Establishment and validation of the nomogram combined with the risk score and other clinical characteristics. (A) Univariable Cox regression of the selected variables in the TCGA-KIRC datasets. (B) Multivariable Cox regression of the remaining variables after Univariable Cox regression in the TCGA-KIRC datasets. (C) A nomogram including the risk score was constructed for predicting OS. (D) ROC curve of the nomogram in the TCGA-KIRC datasets. (E) ROC curve of the nomogram in the ICGC datasets. (F) Calibration plot of the nomogram in the TCGA-KIRC datasets. (G) Calibration plot of the nomogram in the ICGC datasets.
Fig. 8
Fig. 8
The relationship between the risk score and their immune infiltration and the response to immune therapy in ccRCC. (A) The infraction of 22 infiltrative immune cells in the patients of high- and low-risk group in TCGA-KIRC datasets. (B) The activity of immunoactive and immunosuppressive factors in the patients of high- and low-risk group in TCGA-KIRC datasets. (C) The correlation of risk score and immune factors and infiltrative immune cells. (DF) Comparisons of TIDE, exclusion and dysfunction scores between high- and low- risk group in TCGA-KIRC datasets. (G) Comparison of the risk score between predicted responders and non-responders in the TCGA-KIRC datasets. (H) The relative abundance of predicted responders and non-responders in the high- and low-risk group in the TCGA-KIRC datasets. (I) The relative abundance of responders and non-responders in the high- and low-risk group in the IMvigor210 cohort. (J) The distribution of risk score in non-responders and responders in IMvigor210 cohort. (K) Kaplan–Meier curves of OS of high- and low-risk groups in the IMvigor210 cohort. (L) Landmark analysis of OS of high- and low-risk groups in the IMvigor210 cohort.
Fig. 9
Fig. 9
Identification of potential effective drugs for high-risk ccRCC. (A) Comparison of the IC50 between high- and low- risk groups. (B) Scatter plot showed the correlation between risk score and IC50.

Similar articles

References

    1. Sung, H. et al. Global Cancer Statistics 2020: GLOBOCAN Estimates of Incidence and Mortality Worldwide for 36 Cancers in 185 Countries. CA Cancer J. Clin.71, 209–249. 10.3322/caac.21660 (2021). - PubMed
    1. Porta, C. et al. Pharmacotherapy for treating metastatic clear cell renal cell carcinoma. Expert Opin. Pharmacother.18, 205–216. 10.1080/14656566.2017.1282462 (2017). - PubMed
    1. Kotecha, R. R. et al. Towards individualized therapy for metastatic renal cell carcinoma. Nat. Rev. Clin. Oncol.16, 621–633. 10.1038/s41571-019-0209-1 (2019). - PubMed
    1. Gavish, A. et al. Hallmarks of transcriptional intratumour heterogeneity across a thousand tumours. Nature618, 598–606. 10.1038/s41586-023-06130-4 (2023). - PubMed
    1. Gonzalez-Silva, L. et al. Tumor Functional Heterogeneity Unraveled by scRNA-seq Technologies. Trends Cancer6, 13–19. 10.1016/j.trecan.2019.11.010 (2020). - PubMed

MeSH terms