

Spatial scale effects on the trade-offs and synergies of ecosystem services in China's Huaihe river basin
- PMID: 40596372
- PMCID: PMC12218309
- DOI: 10.1038/s41598-025-06753-9
Spatial scale effects on the trade-offs and synergies of ecosystem services in China's Huaihe river basin
Abstract
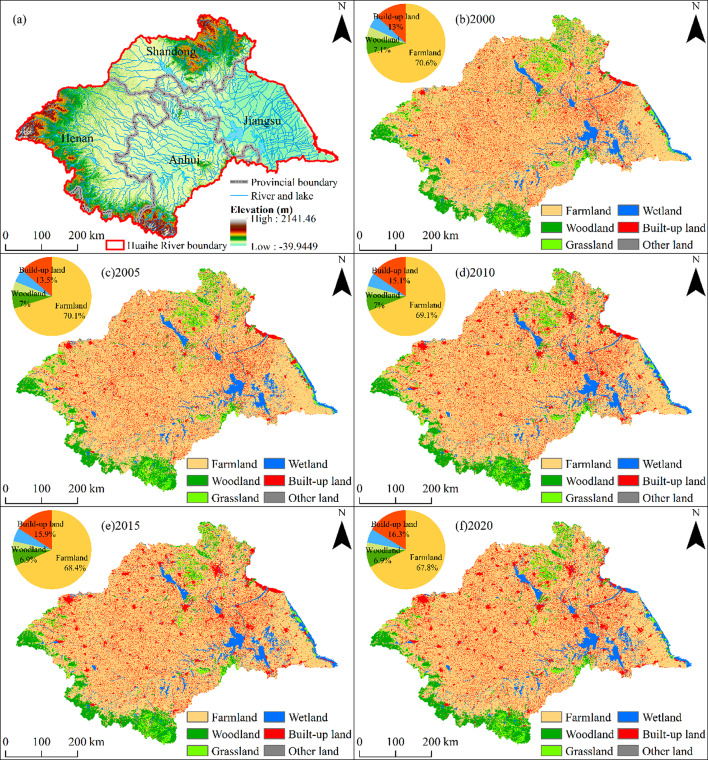
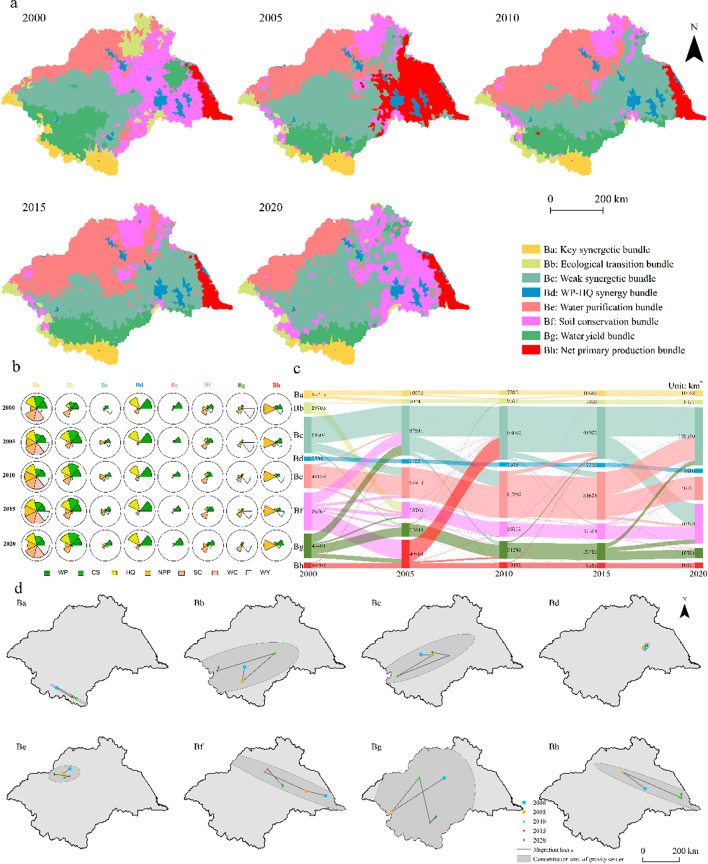
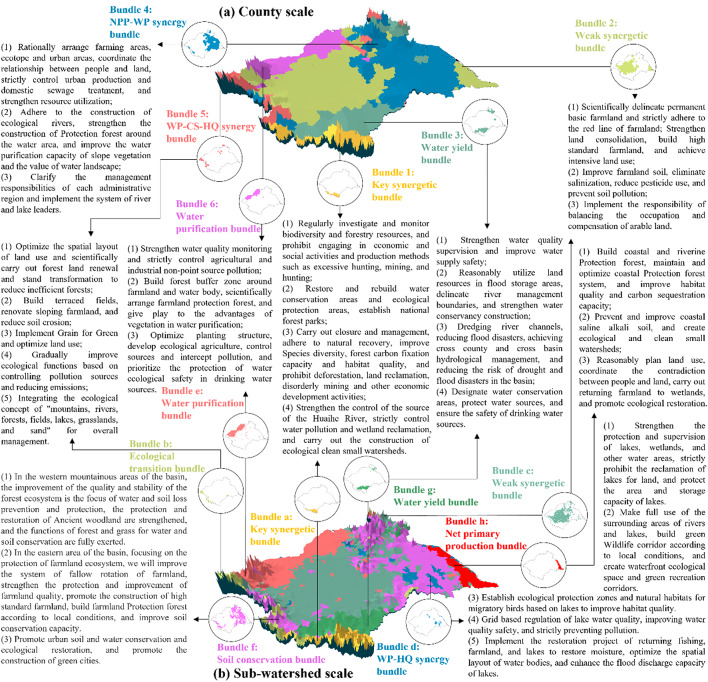
Quantifying the trade-offs and synergies among ecosystem services (ESs) and exploring their spatial scale effects are essential to guide sustainable and diversified ecosystem management. This study systematically analyzed the trade-offs and synergies between seven ESs, including water purification (WP), carbon storage (CS), habitat quality (HQ), net primary productivity (NPP), soil conservation (SC), water conservation (WC), and water yield (WY) using self-organizing feature map methods. Further, we used geographically weighted regression to quantify the effect of spatial scales (county and sub-watershed) on the trade-offs and synergies (bundles) of ESs and their spatial distribution in the Huaihe river basin from 2000 to 2020. The results indicated that (1) from 2000 to 2020, WP, NPP, and WC showed an upward trend, with the most significant increase in WC (an average increase of 15.03 mm). CS and HQ showed a downward trend. (2) The relationship between CS, HQ, NPP, SC, and WC was synergistic at both County and sub-watershed scales, and there was a substantial trade-off between WP and WY. from 2000 to 2020, the average correlation coefficients at the county scale and the sub-watershed scale were - 0.546 and - 0.434 respectively (p < 0.001). the synergy between CS, HQ, NPP, SC, and WC mainly occurred in mountainous and hilly areas, while the trade-off between WP and other ESs mainly appeared in the central plains. The relationship between WP and other ESs developed in the trade-off direction, and the other ES optimized in the collaborative direction. In terms of spatial distribution, the synergy area between most ESs is larger than the trade-off area, and the synergy area between HQ-NPP and WC-WY at the county scale is significantly larger than that at the sub-watershed scale. The average synergy area of each ES pair at the county scale is 20.48% larger than that at the sub-watershed scale. (3) Different ecosystem combinations provided six and eight ES bundles that differed in ES composition and quantity at the county and sub-watershed scales. The key synergetic bundle in the Southern Tongbai Dabie mountain is shrinking, which is more evident at the sub-watershed scale. the discovered spatial patterns, dynamics, and scale effects of ecosystem services provide helpful baseline information for exploring sustainable ecosystem management and cross-scale planning strategies in the Huaihe river basin.
Keywords: Ecosystem service; Ecosystem service bundle; Huaihe river basin; Migration of gravity center; Self-organizing feature map; Trade-off and synergy.
© 2025. The Author(s).
Conflict of interest statement
Declarations. Competing interests: The authors declare no competing interests.
Figures


References
-
- Daily, G. C., Nature’s & Services Societal Dependence on Natural Ecosystems in: Nature’s Services: Societal Dependence on Natural Ecosystems (1997). Yale University Press. pp. 454–464 (2013). (1997).
-
- Ma, S., Wang, L. J., Zhu, D. & Zhang, J. Spatiotemporal changes in ecosystem services in the conservation priorities of the Southern hill and mountain belt. China. Ecol. Indic.122, 107225 (2021). - DOI
-
- Costanza, R. et al. Twenty years of ecosystem services: how Far have we come and how Far do we still need to go? Ecosyst. Serv.28, 1–16 (2017). - DOI
LinkOut - more resources
Full Text Sources
