

Adaptive neuro-fuzzy inference system optimization of natural rubber latex modified concrete's mechanical Properties
- PMID: 40596395
- PMCID: PMC12218361
- DOI: 10.1038/s41598-025-05852-x
Adaptive neuro-fuzzy inference system optimization of natural rubber latex modified concrete's mechanical Properties
Abstract
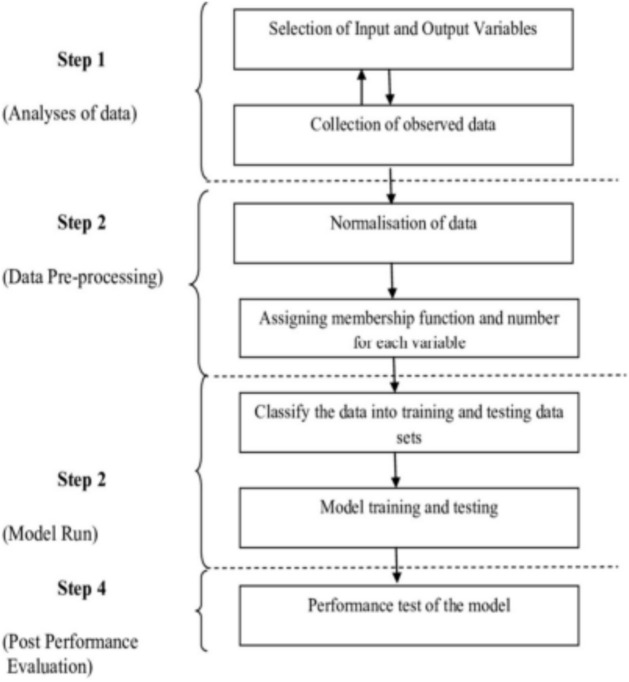
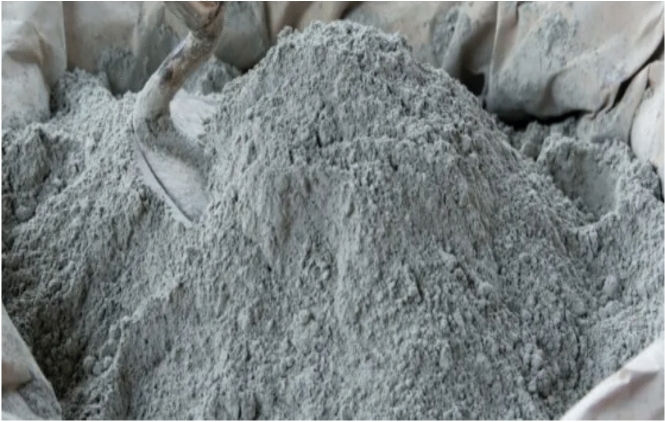
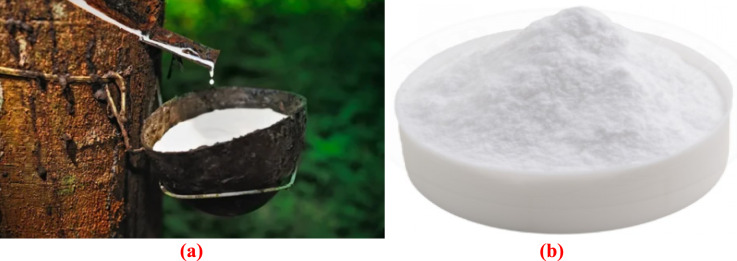
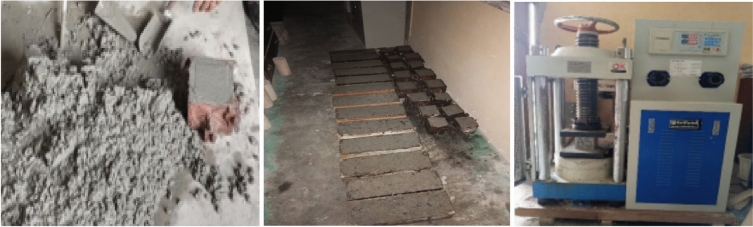
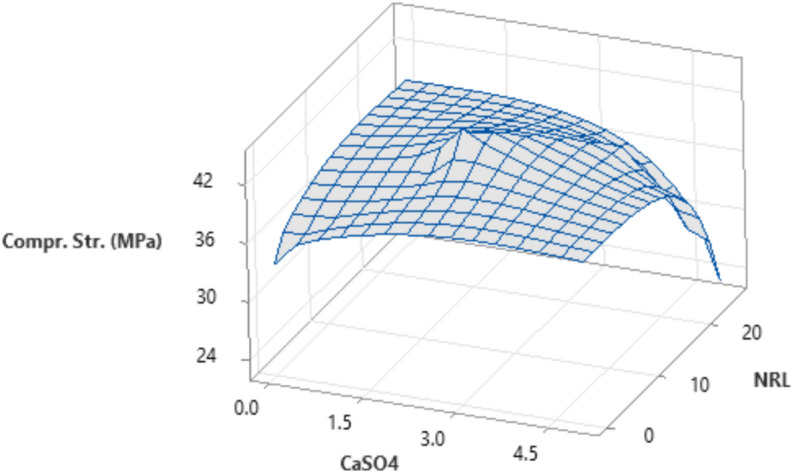
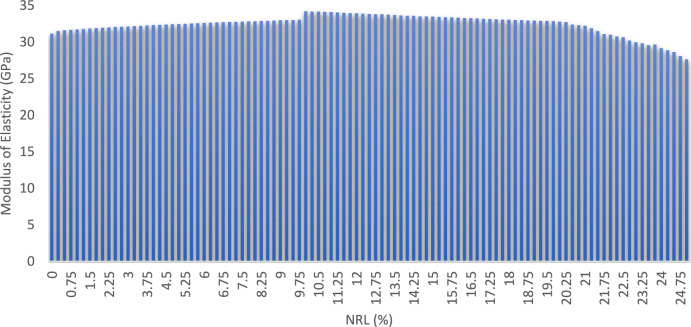
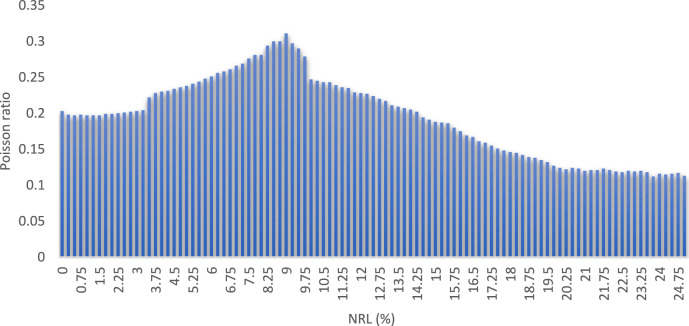
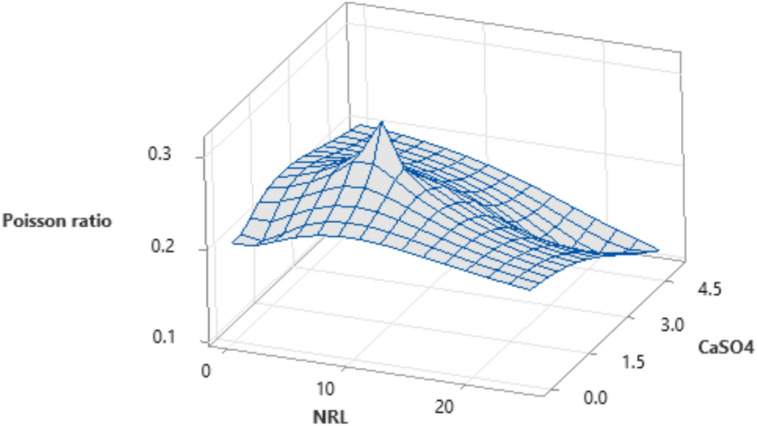
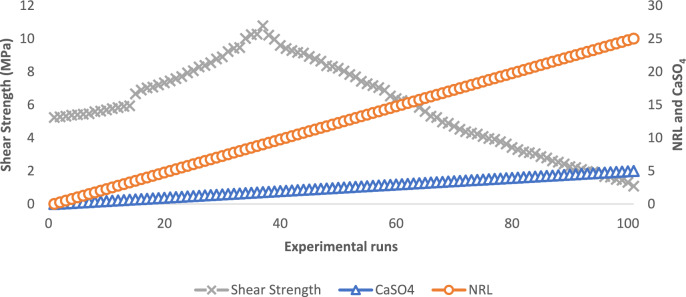
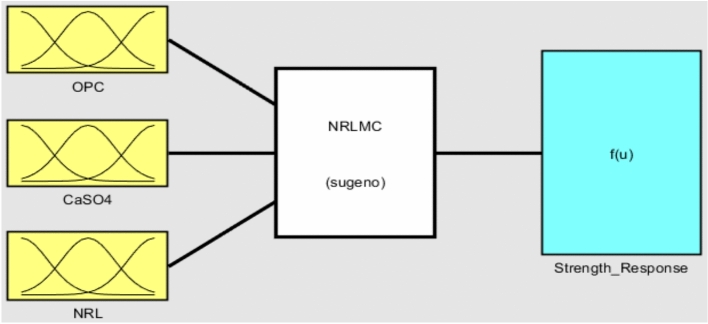
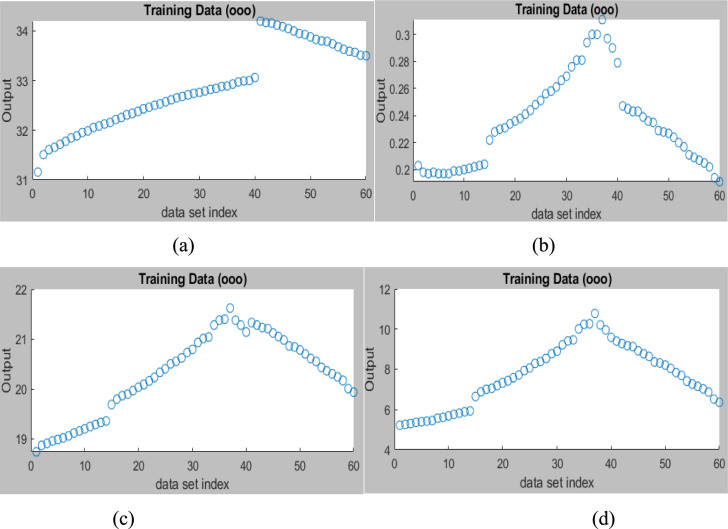
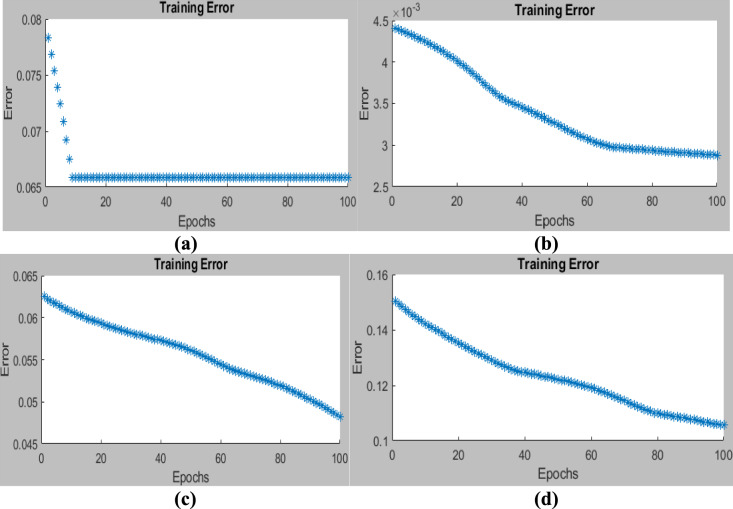
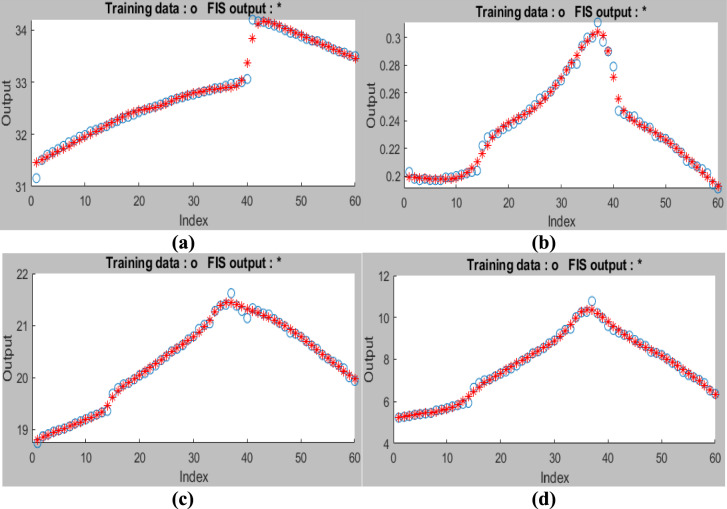
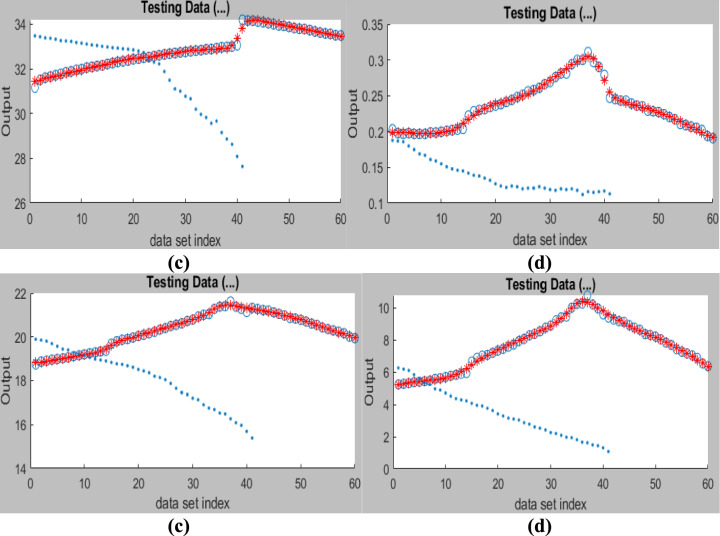
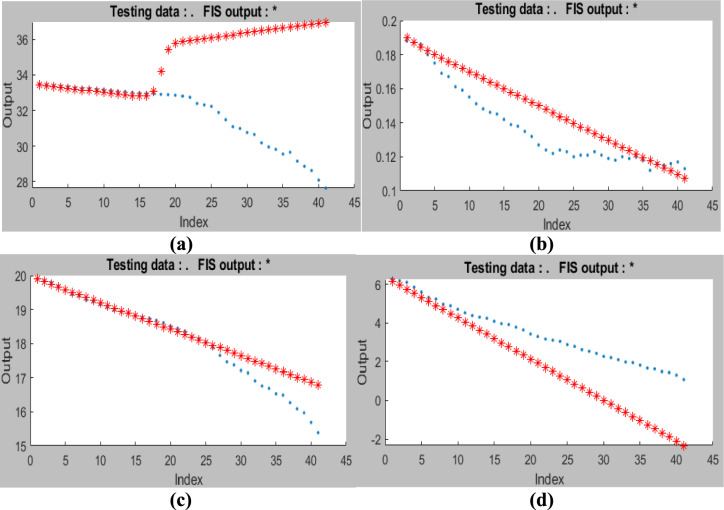
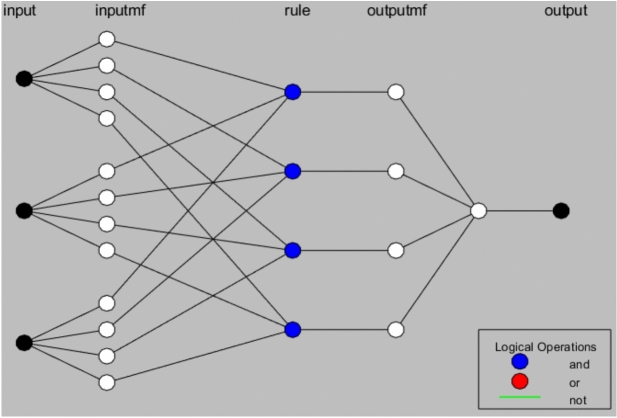
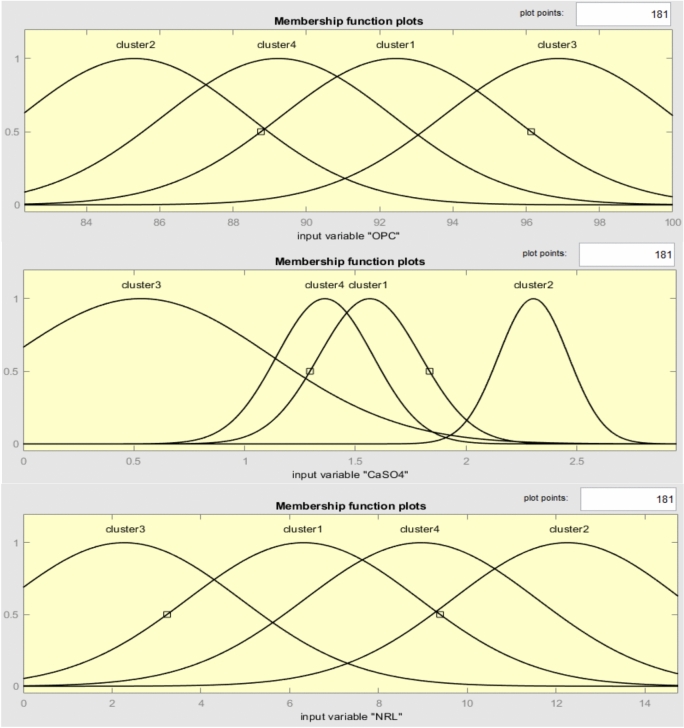
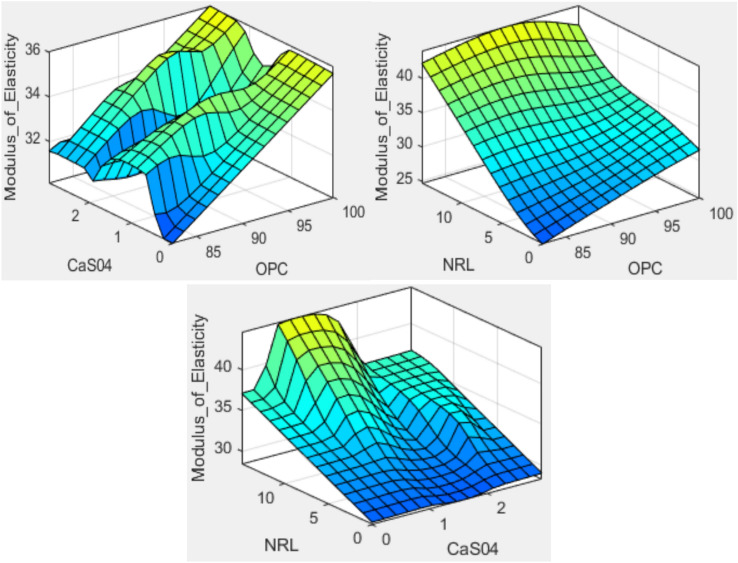
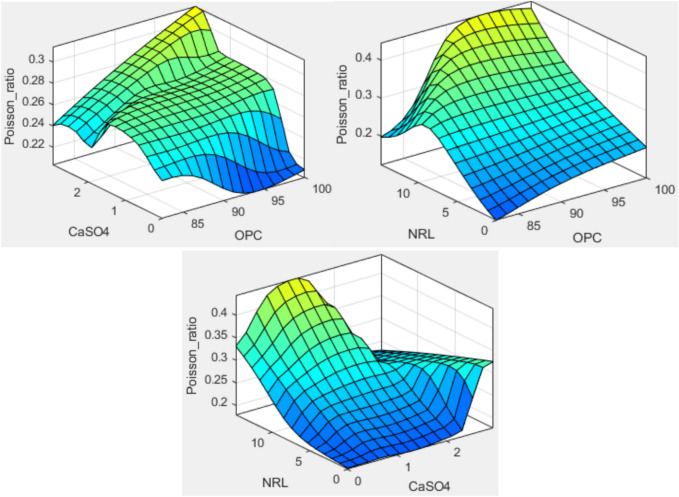
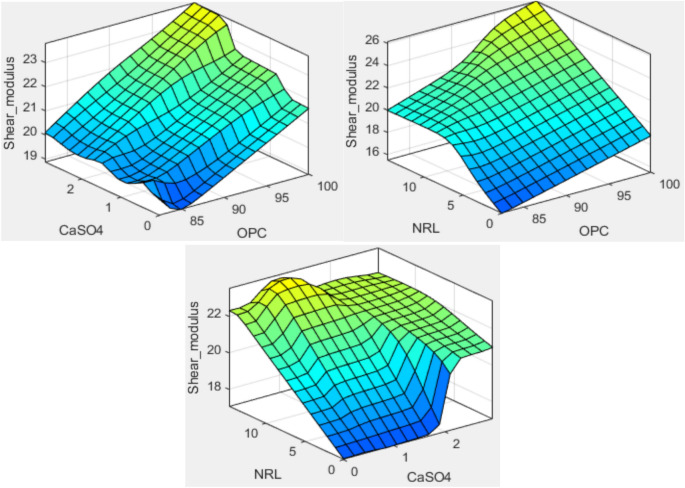
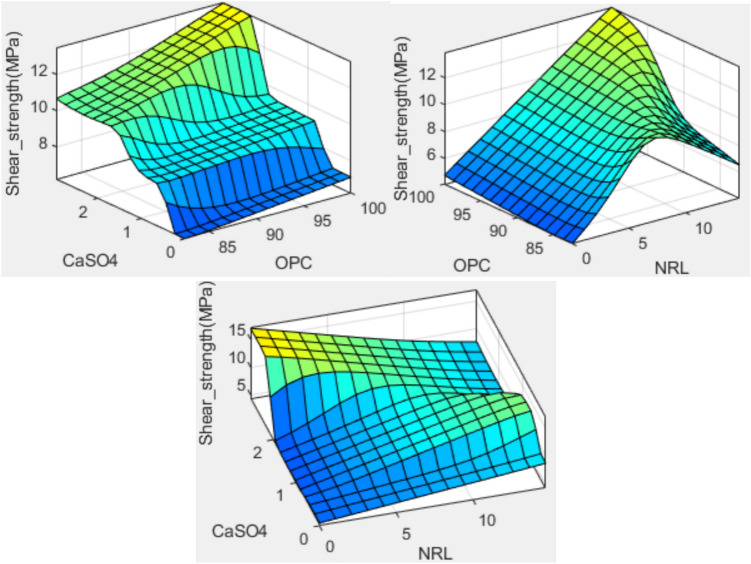
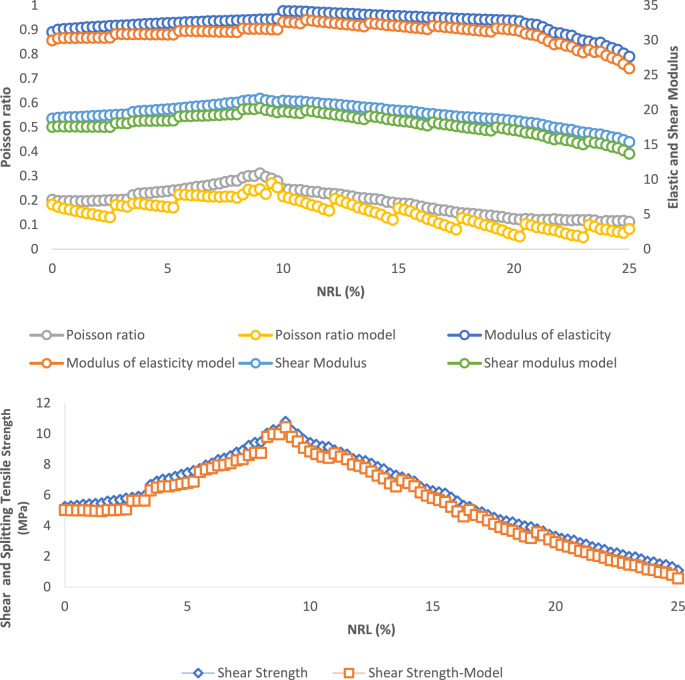
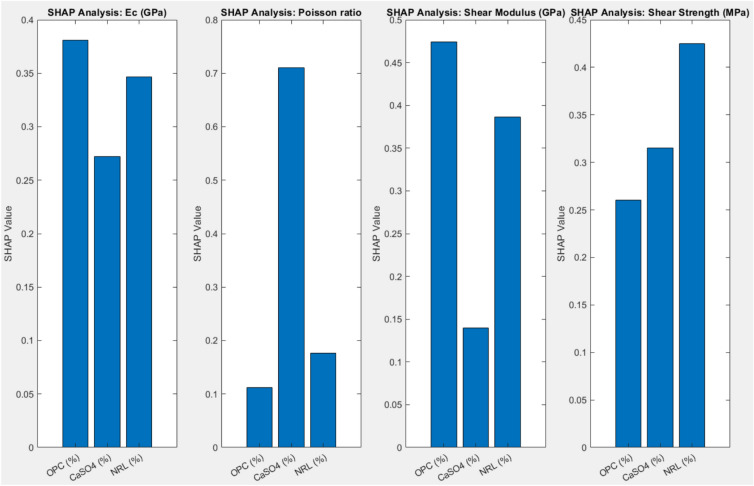
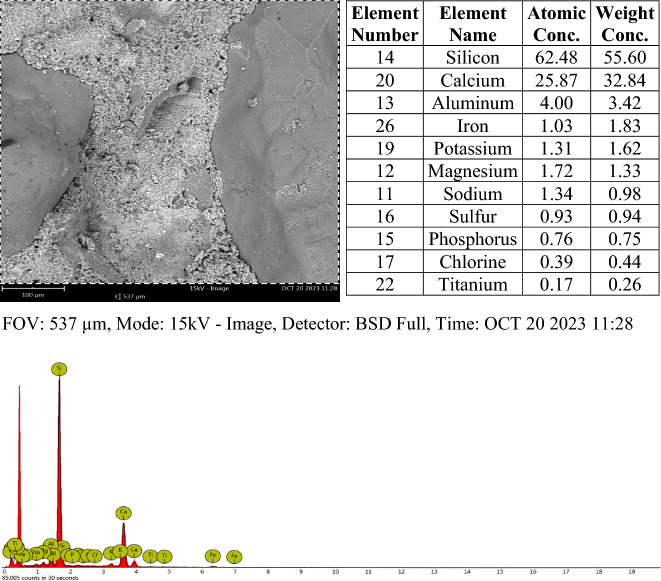
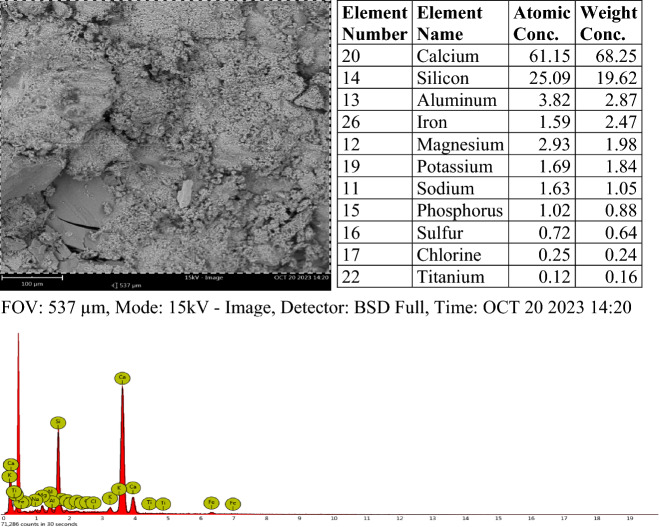
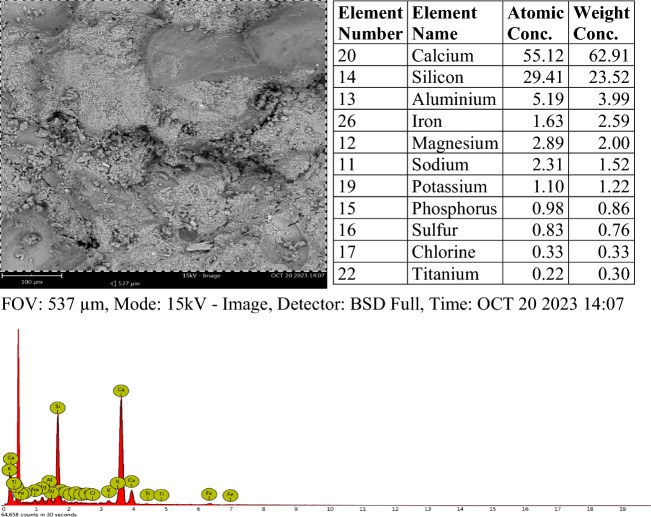
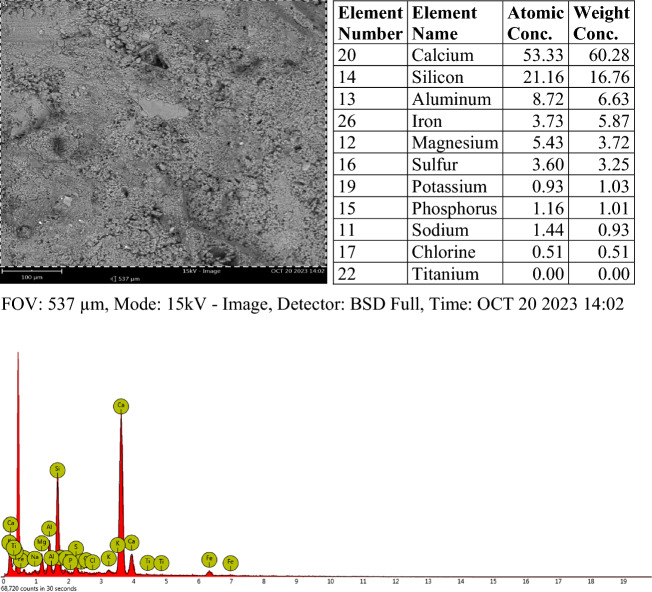
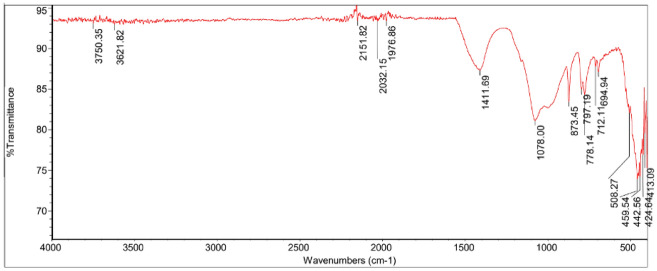
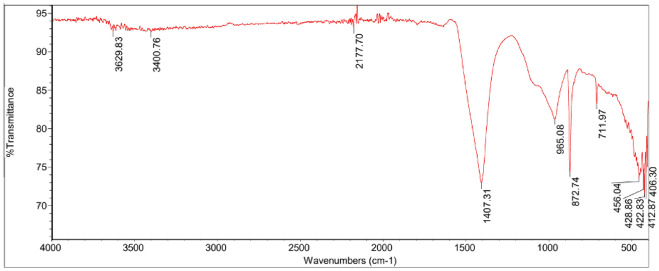
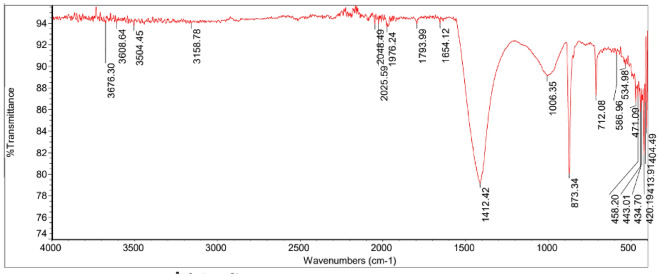
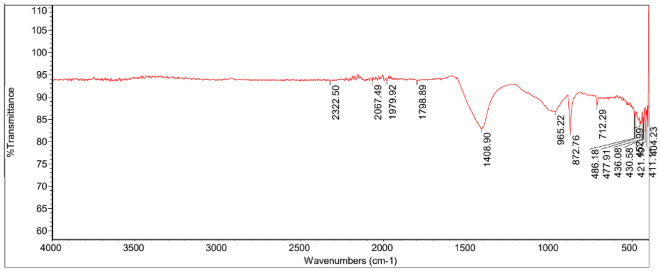
The study investigates the optimization of Natural Rubber Latex Modified Concrete (NRLMC) using an Adaptive Neuro-Fuzzy Inference System (ANFIS) to enhance predictive accuracy and material performance. Traditional laboratory testing for concrete properties is often time-consuming, costly, and prone to variability due to environmental and procedural inconsistencies. Machine learning techniques, such as ANFIS, offer a robust alternative by effectively modelling complex, nonlinear relationships in material behavior based on experimental data. In this study, laboratory experiments were conducted to examine the effects of varying Natural Rubber Latex (NRL) and calcium sulfate (CaSO4) content on NRLMC's mechanical properties. These results served as the foundation for developing an ANFIS model in MATLAB, which demonstrated high accuracy in predicting key concrete properties. The optimal mix was identified as 10% NRL and 2% CaSO4, yielding a compressive strength of 44.27 MPa and a static modulus of elasticity of 34.20 GPa. Additionally, a Poisson's ratio of 0.311, modulus of rigidity of 21.62 GPa, and shear strength of 10.78 MPa were observed at 9% NRL and 1.8% CaSO4, with strength reductions occurring beyond these thresholds. Microstructural analysis via SEM, EDS, and FTIR confirmed the effective integration of NRL into the cement matrix, enhancing density and uniformity. The ANFIS model exhibited strong predictive performance, with a root mean square error (RMSE) of 1.5434, mean absolute percentage error (MAPE) of 2.89%, and R2 of 0.9795 for the modulus of elasticity. For Poisson's ratio, RMSE was 0.7979, MAPE was 2.25%, and R2 was 0.9834. Similarly, shear modulus yielded an RMSE of 1.7208, MAPE of 2.74%, and R2 of 0.9692, while shear strength had an RMSE of 1.884, MAPE of 2.93%, and R2 of 0.9569. These results validate ANFIS as a reliable tool for accurately predicting concrete properties, reducing the need for extensive experimental trials. Furthermore, SHAP analysis highlights that OPC (%) and NRL (%) play dominant roles in influencing Ec (GPa) and shear strength (MPa), whereas CaSO4 (%) significantly impacts the Poisson's ratio and shear modulus (GPa). This study highlights the potential of NRLMC as a sustainable, high-performance material and demonstrates the efficacy of intelligent modeling for material optimization. By integrating machine learning with experimental data, this research advances the development of environmentally friendly and durable concrete, offering a scalable solution for future construction practices.
Keywords: Modulus of rigidity; Natural rubber latex; Neuro-fuzzy models; Poisson’s ratio; Static modulus of elasticity.
© 2025. The Author(s).
Conflict of interest statement
Declarations. Consent to participate: All authors were highly cooperative and involved in research activities and preparation of this article. Consent for publication: All authors have declared and agreed to publish this research article. Competing interests: The authors declare no competing interests.
Figures

References
-
- Alaneme George, U. & Mbadike Elvis, M. optimization of flexural strength of palm nut fibre concrete using Scheffe’s theory. Mater. Sci. Energy Technol.2(2019), 272–287. 10.1016/j.mset.2019.01.006 (2019). - DOI
-
- Topçu, İB. & Sarıdemir, M. Prediction of rubberized concrete properties using artificial neural network and fuzzy logic. Constr. Build. Mater22(4), 532–540. 10.1016/j.conbuildmat.2006.11.007 (2008). - DOI
-
- Aslani, F. & Gedeon, R. Experimental investigation into the properties of self-compacting rubberised concrete incorporating polypropylene and steel fibers. Struct. Concr.20, 267–281. 10.1002/suco.201800182 (2019). - DOI
LinkOut - more resources
Full Text Sources
