

An explainable multi-task deep learning framework for crash severity prediction using multi-source data
- PMID: 40596431
- PMCID: PMC12216344
- DOI: 10.1038/s41598-025-09226-1
An explainable multi-task deep learning framework for crash severity prediction using multi-source data
Abstract
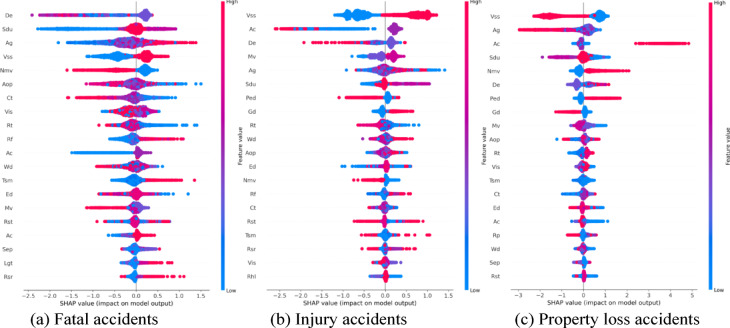
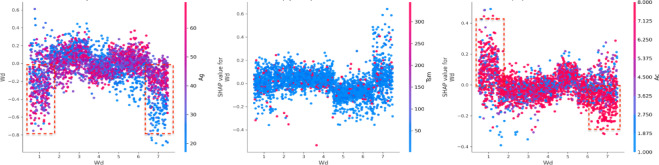
Traffic accidents pose significant global challenges, causing substantial injuries, fatalities, and economic losses. Current research predominantly focuses on single-prediction objectives (e.g., fatality prediction) while neglecting property damage assessments and critical interactions between prediction tasks. Although neural networks demonstrate superior predictive capabilities, their application in traffic safety analysis remains constrained by inherent limitations in causal interpretability, coupled with challenges posed by data imbalance, heterogeneity, and complexity in crash datasets. This study proposes an interpretable multi-task learning framework (Adv MT-DNN) that synergistically integrates an enhanced deep neural network with post-hoc explanation methods for comprehensive crash severity prediction. Our dual-focused approach addresses multiple prediction targets (including fatalities, severe injuries, and property damage). It provides granular insights into contributing factors through SHAP-based feature importance rankings and interaction analysis. Validated using four-year (2018-2021) multi-source traffic data from China, the framework demonstrates significant improvements in prediction accuracy compared to baselines. Nonparametric estimation of the top-8 critical factors (e.g., blood alcohol content, collision type, and accident occurrence period) confirms statistically significant associations with crash severity. The explicit interpretation mechanism bridges the critical gap between predictive performance and model interpretability in traffic safety analytics, providing engineering-relevant insights. This research establishes a robust methodological foundation for developing data-driven road safety policies and intelligent transportation systems, particularly in developing countries with complex traffic ecosystems.
Keywords: Crash severity prediction; Explainable AI (XAI); Multi-source traffic data; Multi-task learning.
© 2025. The Author(s).
Conflict of interest statement
Declarations. Competing interests: The authors declare no competing interests.
Figures


Similar articles
-
Pre-crash injury risk prediction with guaranteed confidence level: a conformal and interpretable framework.Traffic Inj Prev. 2025 Aug 19:1-11. doi: 10.1080/15389588.2025.2538725. Online ahead of print. Traffic Inj Prev. 2025. PMID: 40828994
-
Interpretable multi-variable transformer network for regional-level short-term bicycle crash risk prediction.Accid Anal Prev. 2025 Sep;220:108169. doi: 10.1016/j.aap.2025.108169. Epub 2025 Jul 25. Accid Anal Prev. 2025. PMID: 40714386
-
An interpretable dynamic ensemble selection multiclass imbalance approach with ensemble imbalance learning for predicting road crash injury severity.Sci Rep. 2025 Jul 9;15(1):24666. doi: 10.1038/s41598-025-08935-x. Sci Rep. 2025. PMID: 40634494 Free PMC article.
-
Speed enforcement detection devices for preventing road traffic injuries.Cochrane Database Syst Rev. 2006 Apr 19;(2):CD004607. doi: 10.1002/14651858.CD004607.pub2. Cochrane Database Syst Rev. 2006. Update in: Cochrane Database Syst Rev. 2010 Oct 06;(10):CD004607. doi: 10.1002/14651858.CD004607.pub3. Update in: Cochrane Database Syst Rev. 2010 Nov 10;(11):CD004607. doi: 10.1002/14651858.CD004607.pub4. PMID: 16625608 Updated.
-
Adefovir dipivoxil and pegylated interferon alfa-2a for the treatment of chronic hepatitis B: a systematic review and economic evaluation.Health Technol Assess. 2006 Aug;10(28):iii-iv, xi-xiv, 1-183. doi: 10.3310/hta10280. Health Technol Assess. 2006. PMID: 16904047
References
-
- World Health Organization. Global Status Report on Road Safety 2015 (World Health Organization, 2015).
-
- National Bureau of Statistics of China. China Statistical Yearbook 2020. (2020).
-
- Tambouratzis, T., Souliou, D., Chalikias, M. & Gregoriades, A. Maximising accuracy and efficiency of traffic accident prediction combining information mining with computational intelligence approaches and decision trees. J. Artif. Intell. Soft Comput. Res.4 (1), 31–42. 10.2478/jaiscr-2014-0023 (Jan. 2014).
-
- Zhu, L., Lu, L., Zhang, W., Zhao, Y. & Song, M. Analysis of accident severity for curved roadways based on bayesian networks. Sustainability11 (8). 10.3390/su11082223 (2019).
-
- Arteaga, C., Paz, A. & Park, J. Injury severity on traffic crashes: A text mining with an interpretable machine-learning approach. Saf. Sci.132, 104988. 10.1016/j.ssci.2020.104988 (Dec. 2020).
LinkOut - more resources
Full Text Sources
Miscellaneous
