. 2025 Jul;57(7):1684-1694.
doi: 10.1038/s41588-025-02234-x. Epub 2025 Jul 1.

The long-term effects of chemotherapy on normal blood cells

Affiliations

The long-term effects of chemotherapy on normal blood cells

Emily Mitchell et al. Nat Genet. 2025 Jul.

Erratum in

  • Author Correction: The long-term effects of chemotherapy on normal blood cells.
    Mitchell E, Pham MH, Clay A, Sanghvi R, Williams N, Pietsch S, Hsu JI, Øbro NF, Jung H, Vedi A, Moody S, Wang J, Leonganmornlert D, Spencer Chapman M, Dunstone E, Santarsieri A, Cagan A, Machado HE, Baxter EJ, Follows G, Hodson DJ, McDermott U, Doherty GJ, Martincorena I, Humphreys L, Mahbubani K, Saeb Parsy K, Takahashi K, Goodell MA, Kent D, Laurenti E, Campbell PJ, Rahbari R, Nangalia J, Stratton MR. Mitchell E, et al. Nat Genet. 2025 Aug;57(8):2075. doi: 10.1038/s41588-025-02315-x. Nat Genet. 2025. PMID: 40745026 Free PMC article. No abstract available.

Abstract

Several chemotherapeutic agents act by increasing DNA damage in cancer cells, triggering cell death. However, there is limited understanding of the extent and long-term consequences of collateral DNA damage in normal tissues. To investigate the impact of chemotherapy on mutation burdens and the cell population structure of normal tissue, we sequenced blood cell genomes from 23 individuals aged 3-80 years who were treated with a range of chemotherapy regimens. Substantial additional somatic mutation loads with characteristic mutational signatures were imposed by some chemotherapeutic agents, but the effects were dependent on the drug and blood cell types. Chemotherapy induced premature changes in the cell population structure of normal blood, similar to those caused by normal aging. The results show the long-term biological consequences of cytotoxic agents to which a substantial fraction of the population is exposed as part of disease management, raising mechanistic questions and highlighting opportunities for the mitigation of adverse effects.


Conflict of interest statement

Competing interests: G.J.D. and U.M. are employees of and shareholders in AstraZeneca. M.R.S. and P.J.C. are cofounders of and shareholders in Quotient Therapeutics. The other authors declare no competing interests.

Figures

Fig. 1
Fig. 1. Donor information and experimental approach.
a, Donor demographic details, chemotherapy exposure and sample information. CC, colorectal carcinoma; LC, lung cancer; NB, neuroblastoma; FL, follicular lymphoma; DLBL, diffuse large B cell lymphoma; MZL, marginal zone lymphoma; LL, lymphoplasmacytic lymphoma; M, multiple myeloma; HL, Hodgkin lymphoma; 5FU, 5-fluorouracil; Topo, topoisomerase. b, Experimental approach.
Fig. 2
Fig. 2. Mutation burden and mutational signatures in normal and chemotherapy-exposed blood cells.
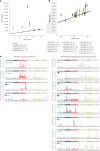
a, Burden of SBS across normal individuals and the four chemotherapy-exposed individuals with the highest SBS burdens. The points represent individual HSPC colonies. The boxes indicate the median and interquartile range; the whiskers denote the minimum and maximum values. The black line represents a regression of age on mutation burden across the unexposed individuals, with the 95% confidence interval shaded. Annotations indicate the corresponding individuals from Fig. 1, providing details on the type of malignancy (as previously defined) and chemotherapy treatment (1, platinum agents; 2, alkylating agents; 3, antimetabolites; 4, topoisomerase I inhibitors; 5, topoisomerase II inhibitors; 6, vinca alkaloids; 7, cytotoxic antibiotics). b, Depiction of data as in a, but the y axis is cut off at 2,000 SBSs for better visualization of the majority of the chemotherapy-exposed cohort data. The points represent individual HSPC colonies. The boxes indicate the median and interquartile range; the whiskers denote the minimum and maximum values. The gray shading in b represents the 95% CI of the regression of age on mutation burden across the unexposed individuals. The black line represents a regression of age on mutation burden, with the 95% confidence interval shaded. c, Mutational signatures extracted using the hierarchical Dirichlet process (HDP) from the full dataset of normal and chemotherapy-exposed HSPC colonies and duplex sequencing of bulk mature blood cell subsets. Source data
Fig. 3
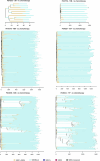
Fig. 3. Phylogenetic trees and mutational signatures across a range of normal and chemotherapy-exposed individuals.
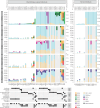
Phylogenies were constructed using shared mutation data and the algorithm MPBoot (Methods). Branch lengths correspond to SBS burdens (x axes). A stacked bar plot represents the signatures contributing to each branch, with the color code below the trees. SBSUnassigned indicates mutations that could not confidently be assigned to any reported signature. Drugs in parentheses are those received by the individual at the same time but not believed to be the mutagenic agents.
Fig. 4
Fig. 4. Mutation burden and SBS mutational signatures across different blood cell types.
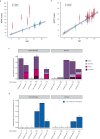
Stacked bar plots represent the absolute contributions of each SBS mutational signature to the SBS mutation burden across cell types (left), compared to the proportionate contribution of each signature (right). HSPC data were generated by pooling HSPC WGS colony data from each individual. Mature blood cell data were generated using duplex sequencing of ~40,000 cells of each type. For the normal unexposed individuals, the T cell subset data are from CD4+ T cells; for the chemotherapy-exposed individuals, the T cell subsets contain both CD4+ and CD8+ T cells. SBSUnassigned indicates mutations that could not confidently be assigned to any reported signature. SBSNA indicates that duplex sequencing data are unavailable for this subset. In seven individuals, granulocyte mutation profiles were available, which were not discernibly different from the mutational spectra observed in HSPCs and monocytes from those individuals. Due to the lack of availability of this cell type for most patients, the data are not shown. Source data
Fig. 5
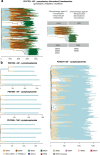
Fig. 5. HSPC phylogenies for two normal unexposed and two chemotherapy-exposed adult individuals.
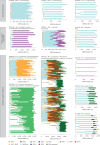
a,b, Phylogenies for two normal unexposed donors: one young adult (a) and one older adult (b). c,d, Phylogenies for two young adult chemotherapy-treated individuals, both with more than one chemotherapy exposure. Phylogenies were constructed using shared mutation data and the algorithm MPBoot (Methods). Branch lengths reflect the number of mutations assigned to the branch, with the terminal branches adjusted for sequence coverage; the overall root-to-tip branch lengths have been normalized to the same total length (because all colonies were collected from a single time point). The y axis represents the number of SBSs accumulating over time. Each tip on a phylogeny represents a single colony, with the respective numbers of colonies of each cell and tissue type recorded at the top. Onto these trees, we have layered clone- and colony-specific phenotypic information. We have highlighted branches on which we have identified known oncogenic drivers in 1 of 18 clonal hematopoiesis genes (Supplementary Table 2) color-coded by gene. A heat map at the bottom of each phylogeny highlights colonies from known driver clades colored by gene and the expanded clades (defined as those with a clonal fraction of >1%) in blue. In the individual in d, the AML was derived from the biallelic TP53-mutated clade carrying TP53 p.I195F and TP53 p.C176Y. Drugs not highlighted in bold text are those received by the individual at the same time but not believed to be the mutagenic agents.
Extended Data Fig. 1
Extended Data Fig. 1. Mean sequencing depth in the normal and chemotherapy exposed HSPC colonies used for mutation burden analysis, and patterns of mutation accumulation.
a, Box plot representing the quartile distribution of mean sequencing depth in 90 colonies from normal (blue) and 189 colonies from chemotherapy exposed (red) individuals. The boxes indicate the median and interquartile range, the whiskers denote the minimum and maximum, with outlying values represented as points. b, Boxplot comparing the mean sequencing depth between Alkylating/ Platinum agent exposed and non-exposed colonies. The number of colonies in each agent group are shown at the top of the plot. The boxes indicate the median and interquartile range, the whiskers denote the minimum and maximum, with outlying values represented as points. c-f, HSC single base substitutions associated with chemotherapy (c,d) and age (e,f). CC, colorectal carcinoma; LC, lung cancer; NB, neuroblastoma; FL, follicular lymphoma; DLBL, diffuse large B cell lymphoma; MZL, marginal zone lymphoma; LL, lymphoplasmacytic lymphoma; M, multiple myeloma; HL, Hodgkin lymphoma; AML, acute myeloid leukaemia; 1, Platinum agents; 2,Alkylating agents; 3,Antimetabolites; 4,Topo I inhibitors; 5,Topo II inhibitors; 6,Vinca alkaloids; 7,Cytotoxic antibiotics. Source data
Extended Data Fig. 2
Extended Data Fig. 2. Indel mutational burden in normal and chemotherapy exposed HSPCs.
Burden of small indels in single HSPC colonies with age (years) across normal (blue) and the four chemotherapy exposed (red) individuals with the highest indel burdens. The points represent individual HSPC colonies. The boxes indicate the median and interquartile range, the whiskers denote the minimum and maximum. The blue line represents a regression of age on mutation burden, with 95% CI shaded. b, Depiction of data as in a, but the y-axis is cut off at 120 indels for better visualisation of the majority of the chemotherapy-exposed data. The points represent individual HSPC colonies. The boxes indicate the median and interquartile range, the whiskers denote the minimum and maximum. The blue line represents a regression of age on mutation burden, with 95% CI shaded c,d, Bar plots showing the number of structure variant types (c) and the number of the number of independently acquired autosomal copy number aberrations (CNAs) (d) in each individual from chemotherapy and normal groups. The absolute number of events found in each individual is shown at the top of each bar. Individuals and the total number of isolated colonies are sorted by age within each group. Source data
Extended Data Fig. 3
Extended Data Fig. 3. Indel signatures that are present in normal and chemotherapy exposed blood.
a, Three indel signatures (ID1/2, ID3/5/9, IDA) were extracted by sigHDP. The context on the x-axis show the contributions of different types of indels, grouped by whether variants are deletions or insertions, the size of the event, the presence within repeat units and the sequence content of the indel. b, The proportion of indels and indels burden per mutational signatures across 22 chemotherapy exposed and 9 normal individuals, extracting using msigHDP (Methods). Each column represents samples from one individual. Signatures with the contribution <5% are considered as ‘unassigned’. Source data
Extended Data Fig. 4
Extended Data Fig. 4. Phylogenetic trees and mutational signatures in normal individuals.
Branch lengths correspond to SBS burdens. A stacked bar plot represents the SBS mutational signatures contributing to each branch with color code below the trees. SBSUnassigned indicates mutations that could not confidently be assigned to any reported signature.
Extended Data Fig. 5
Extended Data Fig. 5. Phylogenetic trees and mutational signatures in individuals treated with alkylating agents.
a, Phylogenetic tree of 48-year-old chemotherapy exposed female (PD47703). Branch lengths correspond to SBS burdens. A stacked bar plot represents the SBS mutational signatures contributing to each branch with colour code below the trees. SBSUnassigned indicates mutations that could not confidently be assigned to any reported signature. She had been treated with chlorambucil and procarbazine at age 10 (early), and bendamustine at age 47 (late). b, Phylogenetic trees and SBS mutational signatures in individuals treated with cyclophosphamide.
Extended Data Fig. 6
Extended Data Fig. 6. Phylogenetic trees and mutational signatures in individuals treated with oxaliplatin.
Branch lengths correspond to SBS burdens. A stacked bar plot represents the SBS mutational signatures contributing to each branch with colour code below the trees. SBSUnassigned indicates mutations that could not confidently be assigned to any reported signature.
Extended Data Fig. 7
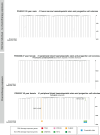
Extended Data Fig. 7. Annotated HSPC phylogenies for two chemotherapy treated individuals.
Phylogenies were constructed for PD37580 (a) and PD47703 (b) individuals using shared mutation data and the algorithm MPBoot (Methods). In all phylogenies, branch lengths reflect the number of SBS mutations assigned to the branch. The y-axis represents the number of SBSs accumulating over time. Each tip on a phylogeny represents a single colony. Chemotherapy agents and the age of exposure to them are shown on top of the trees. a, PD37580 phylogeny of early life, truncated at 400 SBS mutations to allow better visualisation of the timing of acquisition of two early PPM1D mutations (pink). The number of mutations at age 13 was estimated using the linear mixed model described in Mitchell et al with 95% CI based on mutation burden being Poisson distributed as described in methods (241-306 single base subsitutions). b, Comparison of phylogenies created from peripheral blood samples taken from PD44703 one year apart. Pathogenic mutations in PPM1D have been highlighted (pink) to facilitate comparison of clone sizes at each timepoint. In addition a loss of function mutation in CSF3R has been highlighted (blue), which could also be contributing to loss of haematopoietic reserve and cytopenias. Red bars show the size of clonal fractions at each timepoint. Terminal branches have been adjusted for sequence coverage, and overall root-to-tip branch lengths have been normalized to the same total length (because all colonies were collected from a single time point).
Extended Data Fig. 8
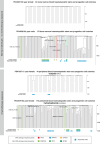
Extended Data Fig. 8. HSPC phylogenies for three young adult individuals.
Phylogenies for one normal young adult individual (top) and two young adult chemotherapy-treated individuals (bottom) were constructed using shared mutation data and the algorithm MPBoot (Methods). Branch lengths reflect the number of mutations assigned to the branch with terminal branches adjusted for sequence coverage, and overall root-to-tip branch lengths have been normalised to the same total length (because all colonies were collected from a single time point). The y-axis represents the number of SBSs accumulating over time. Each tip on a phylogeny represents a single colony, with the respective numbers of colonies of each cell and tissue type recorded at the top. Onto these trees, we have layered clone and colony-specific phenotypic information. We have highlighted branches on which we have identified known oncogenic drivers in one of 18 clonal haematopoiesis genes (Supplementary Table 2) colour-coded by gene. A heat map at the bottom of each phylogeny highlights colonies from known driver clades coloured by gene, and the expanded clades (defined as those with a clonal fraction above 1%) in blue. Regarding the treatment of PD50307 donor, carboplatin was administered via intravenous infusion on Day 1, followed by Etoposide on the same day. Subsequently, the patient received oral doses of Etoposide on Days 2 and 3.
Extended Data Fig. 9
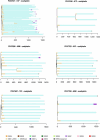
Extended Data Fig. 9. HSPC phylogenies for four older adult individuals.
Phylogenies for two normal individuals (top) and two chemotherapy-treated individuals (bottom) were constructed using shared mutation data and the algorithm MPBoot (Methods). Branch lengths reflect the number of mutations assigned to the branch with terminal branches adjusted for sequence coverage, and overall root-to-tip branch lengths have been normalised to the same total length (because all colonies were collected from a single time point). The y-axis represents the number of SBSs accumulating over time. Each tip on a phylogeny represents a single colony, with the respective numbers of colonies of each cell and tissue type recorded at the top. Onto these trees, we have layered clone and colony-specific phenotypic information. We have highlighted branches on which we have identified known oncogenic drivers in one of 18 clonal haematopoiesis genes (Supplementary Table 2) colour-coded by gene. A heat map at the bottom of each phylogeny highlights colonies from known driver clades coloured by gene, and the expanded clades (defined as those with a clonal fraction above 1%) in blue.

References

    1. DeVita, V. T. Jr. & Chu, E. A history of cancer chemotherapy. Cancer Res.68, 8643–8653 (2008). - PubMed
    1. Tilsed, C. M., Fisher, S. A., Nowak, A. K., Lake, R. A. & Lesterhuis, W. J. Cancer chemotherapy: insights into cellular and tumor microenvironmental mechanisms of action. Front. Oncol.12, 960317 (2022). - PMC - PubMed
    1. Kollmannsberger, C., Hartmann, J. T., Kanz, L. & Bokemeyer, C. Risk of secondary myeloid leukemia and myelodysplastic syndrome following standard-dose chemotherapy or high-dose chemotherapy with stem cell support in patients with potentially curable malignancies. J. Cancer Res. Clin. Oncol.124, 207–214 (1998). - PMC - PubMed
    1. Bhatia, S. Therapy-related myelodysplasia and acute myeloid leukemia. Semin. Oncol.40, 666–675 (2013). - PMC - PubMed
    1. Morton, L. M. et al. Association of chemotherapy for solid tumors with development of therapy-related myelodysplastic syndrome or acute myeloid leukemia in the modern era. JAMA Oncol.5, 318–325 (2019). - PMC - PubMed

Substances