

Combined association of triglyceride-glucose index and systemic inflammation index on all-cause and cardiovascular mortality
- PMID: 40596460
- PMCID: PMC12215866
- DOI: 10.1038/s41598-025-06770-8
Combined association of triglyceride-glucose index and systemic inflammation index on all-cause and cardiovascular mortality
Abstract
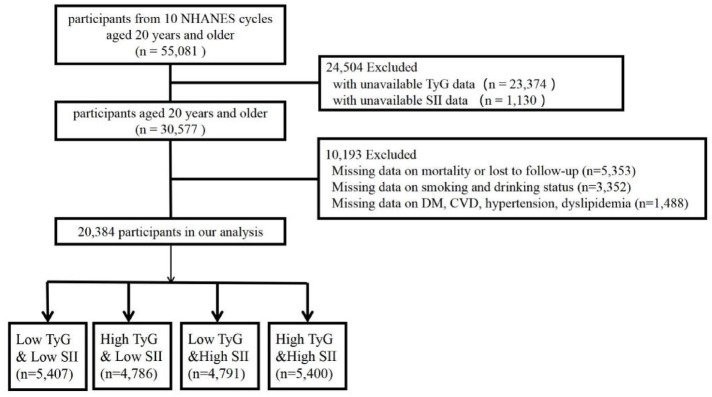
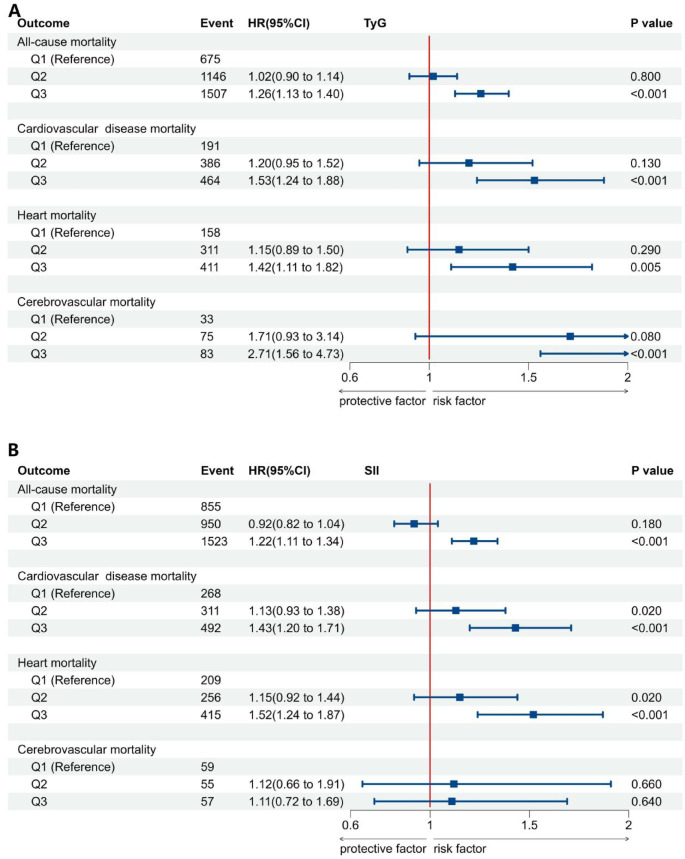
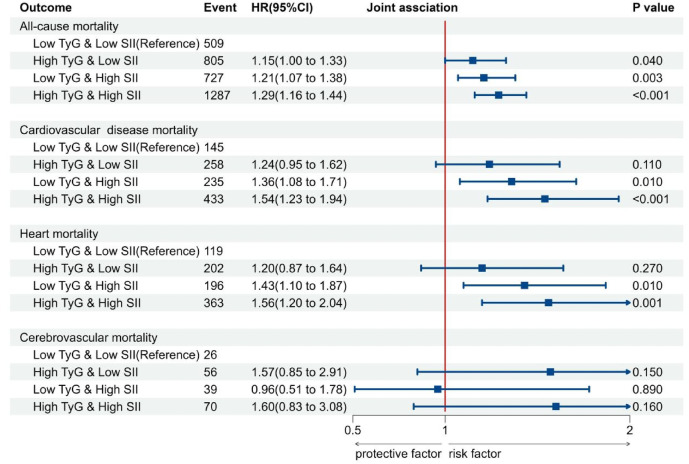
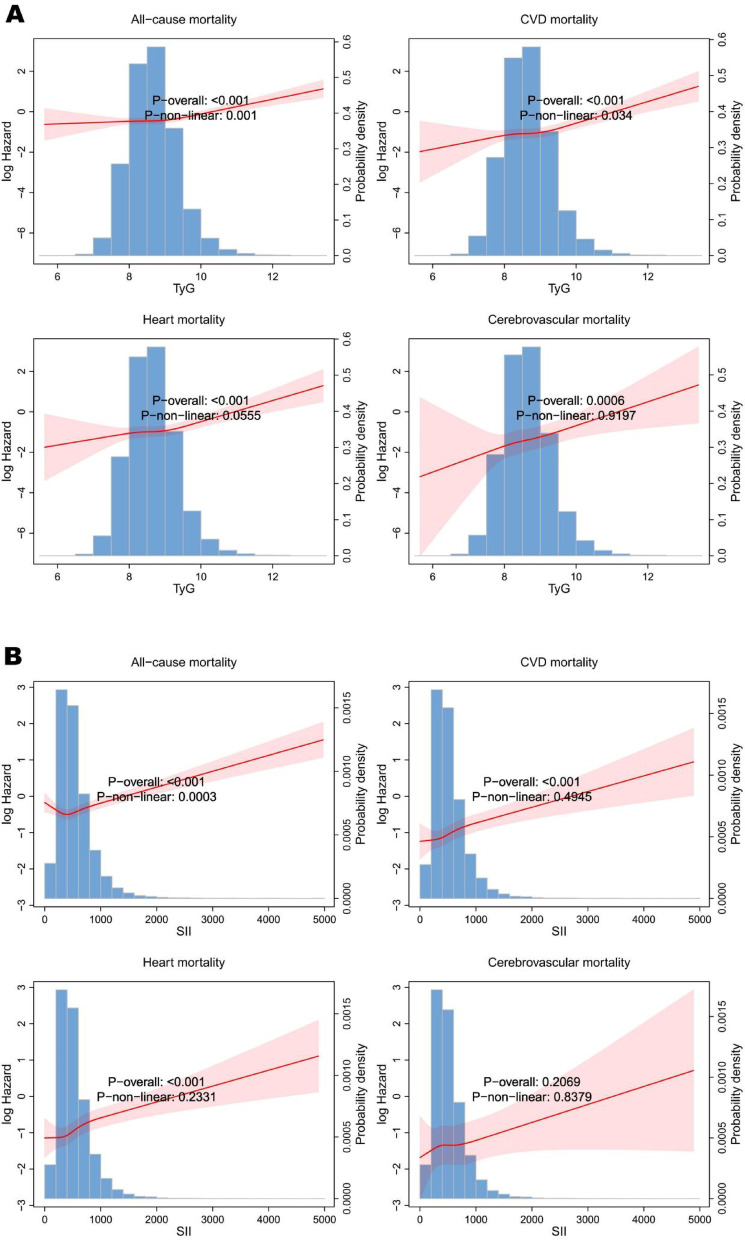
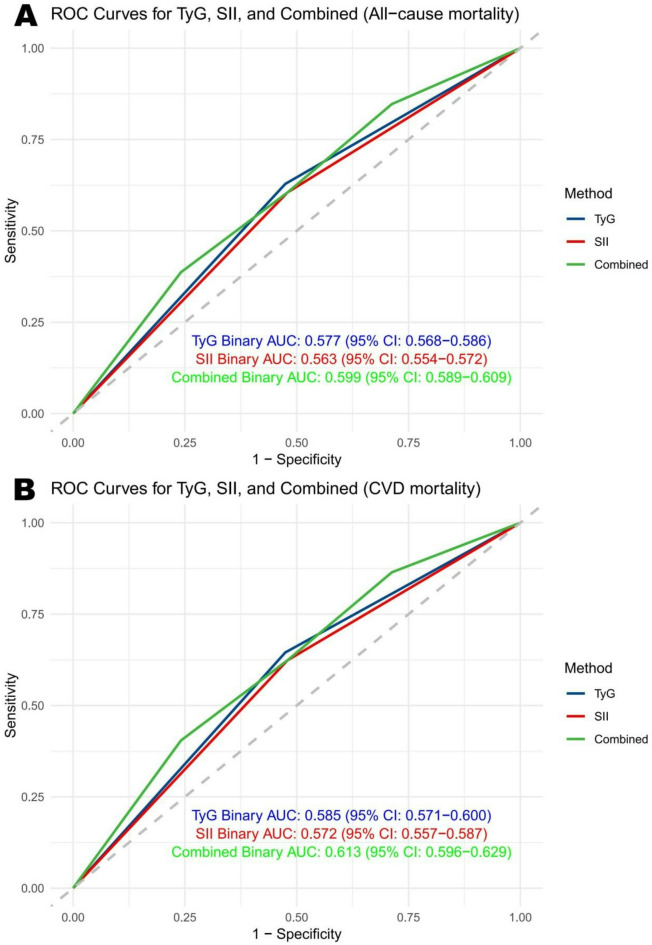
The triglyceride-glucose and systemic inflammation index have been linked to mortality outcomes. However, their combined impact on all-cause and cardiovascular mortality remains unclear. This study aimed to evaluate the individual and combined associations of the TyG index and SII with mortality using data from NHANES. Associations between TyG, SII, and mortality were assessed using multivariable Cox proportional hazards models and restricted cubic spline (RCS) regression models. Subgroup and sensitivity analyses were also conducted. Compared to individuals with low TyG and low SII, those with high TyG and high SII had a hazard ratio (HR) of 1.29 (95% CI, 1.16-1.44) for all-cause mortality, 1.54 (95% CI, 1.23-1.94) for cardiovascular mortality, 1.56 (95% CI, 1.20-2.04) for cardiac mortality, and 1.60 (95% CI, 0.83-3.08) for cerebrovascular mortality after full adjustment. The ROC curve analysis indicated that the combination of TyG and SII had an AUC of 0.599 for predicting all-cause mortality and 0.613 for cardiovascular mortality. Subgroup and sensitivity analyses yielded consistent findings. In conclusion, these results underscore the significant combined association of the TyG index and SII on all-cause and cardiovascular mortality, highlighting the importance of jointly assessing these indices to better predict mortality outcomes.
Keywords: Inflammation; Insulin resistance; Mortality; Systemic inflammation index; Triglyceride–glucose index.
© 2025. The Author(s).
Conflict of interest statement
Declarations. Competing interests: The authors declare no competing interests. Ethics approval and consent to participate: The study was performed according to the guidelines of the Helsinki Declaration. Consent to participate was obtained and the National Center for Health Statistics ethics committee approved the protocol of the NHANES study. The data is publicly available, therefore, the ethical approval statement and the requirement for informed consent were waived for this study.
Figures
Similar articles
-
Triglyceride-glucose-related indices and risk of cardiovascular disease and mortality in individuals with cardiovascular-kidney-metabolic (CKM) syndrome stages 0-3: a prospective cohort study of 282,920 participants in the UK Biobank.Cardiovasc Diabetol. 2025 Jul 10;24(1):277. doi: 10.1186/s12933-025-02842-1. Cardiovasc Diabetol. 2025. PMID: 40640813 Free PMC article.
-
Impact of systemic immune inflammation index and systemic inflammation response index on all-cause and cardiovascular mortality in cardiovascular-kidney-metabolic syndrome.Eur J Med Res. 2025 Jul 21;30(1):645. doi: 10.1186/s40001-025-02929-1. Eur J Med Res. 2025. PMID: 40685352 Free PMC article.
-
The association of obesity and lipid-related indicators with all-cause and cardiovascular mortality risks in patients with diabetes or prediabetes: a cross-sectional study based on machine learning algorithms.Front Endocrinol (Lausanne). 2025 Jun 2;16:1492082. doi: 10.3389/fendo.2025.1492082. eCollection 2025. Front Endocrinol (Lausanne). 2025. PMID: 40529828 Free PMC article.
-
Does diabetes modify the triglyceride-glucose index associated with cardiovascular events and mortality? A meta-analysis of 50 cohorts involving 7,239,790 participants.Cardiovasc Diabetol. 2025 Jan 27;24(1):42. doi: 10.1186/s12933-025-02585-z. Cardiovasc Diabetol. 2025. PMID: 39871273 Free PMC article.
-
Relationship between the triglyceride-glucose index and risk of cardiovascular diseases and mortality in the general population: a systematic review and meta-analysis.Cardiovasc Diabetol. 2022 Jul 1;21(1):124. doi: 10.1186/s12933-022-01546-0. Cardiovasc Diabetol. 2022. PMID: 35778731 Free PMC article.
References
-
- Zhao, D., Liu, J., Wang, M., Zhang, X. & Zhou, M. Epidemiology of cardiovascular disease in China: Current features and implications. Nat Rev Cardiol.16(4), 203–212. 10.1038/s41569-018-0119-4 (2019). - PubMed
-
- Brookes, A. Global Epidemiology of Cardiovascular Disease.
-
- Yi, J., Wang, L., Guo, X. & Ren, X. Association of Life’s Essential 8 with all-cause and cardiovascular mortality among US adults: A prospective cohort study from the NHANES 2005–2014. Nutr. Metab. Cardiovasc. Dis.33(6), 1134–1143. 10.1016/j.numecd.2023.01.021 (2023). - PubMed
MeSH terms
Substances
Grants and funding
LinkOut - more resources
Full Text Sources
Medical
