. 2025 Jul 1;8(1):964.
doi: 10.1038/s42003-025-08393-1.

Leveraging chorionic villus biopsies for the derivation of patient-specific trophoblast stem cells

Affiliations

Leveraging chorionic villus biopsies for the derivation of patient-specific trophoblast stem cells

Kaela M Varberg et al. Commun Biol. .

Abstract

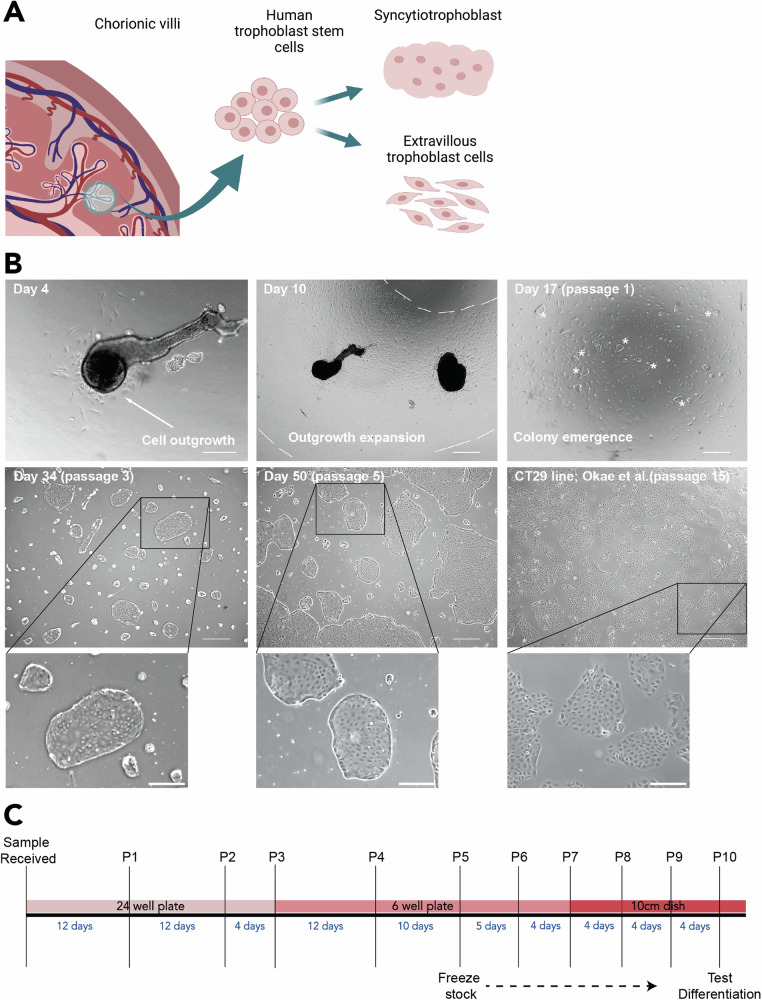
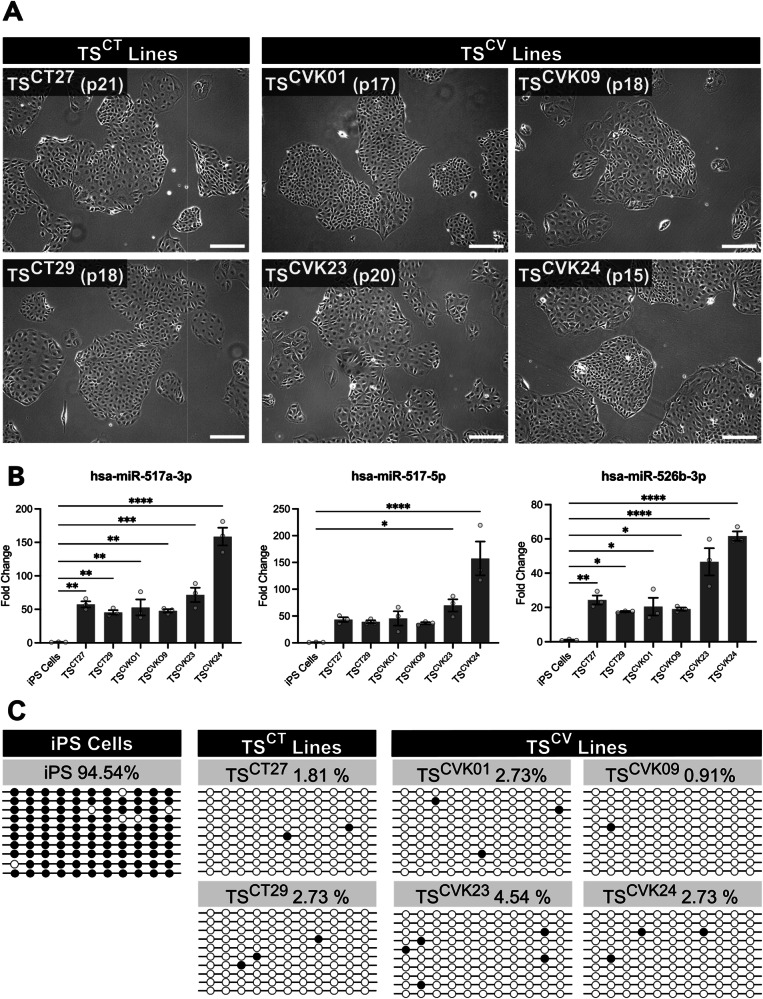
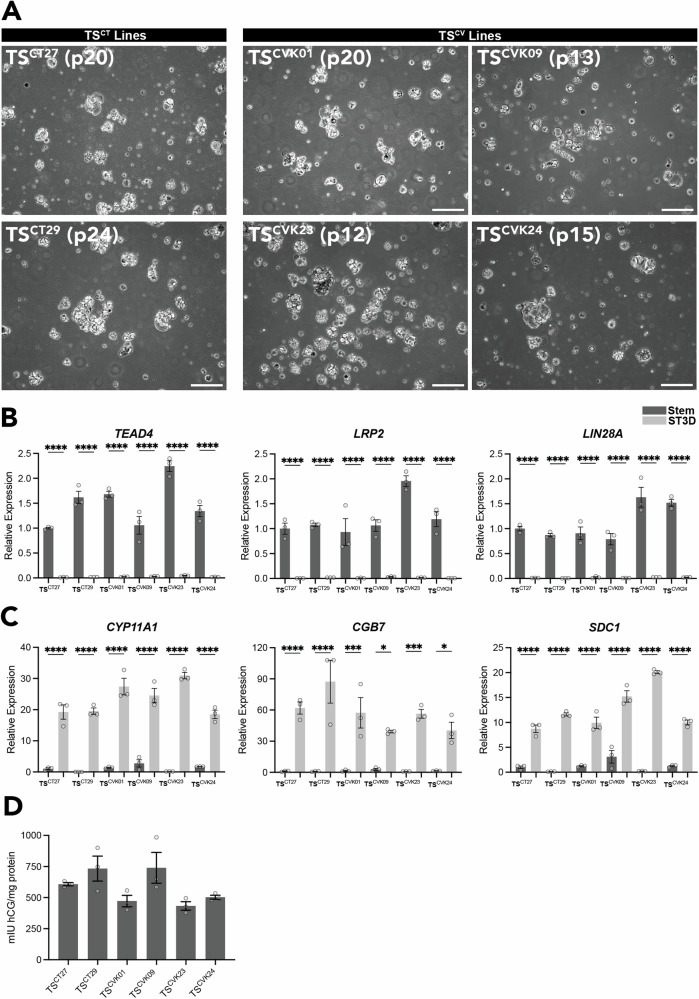
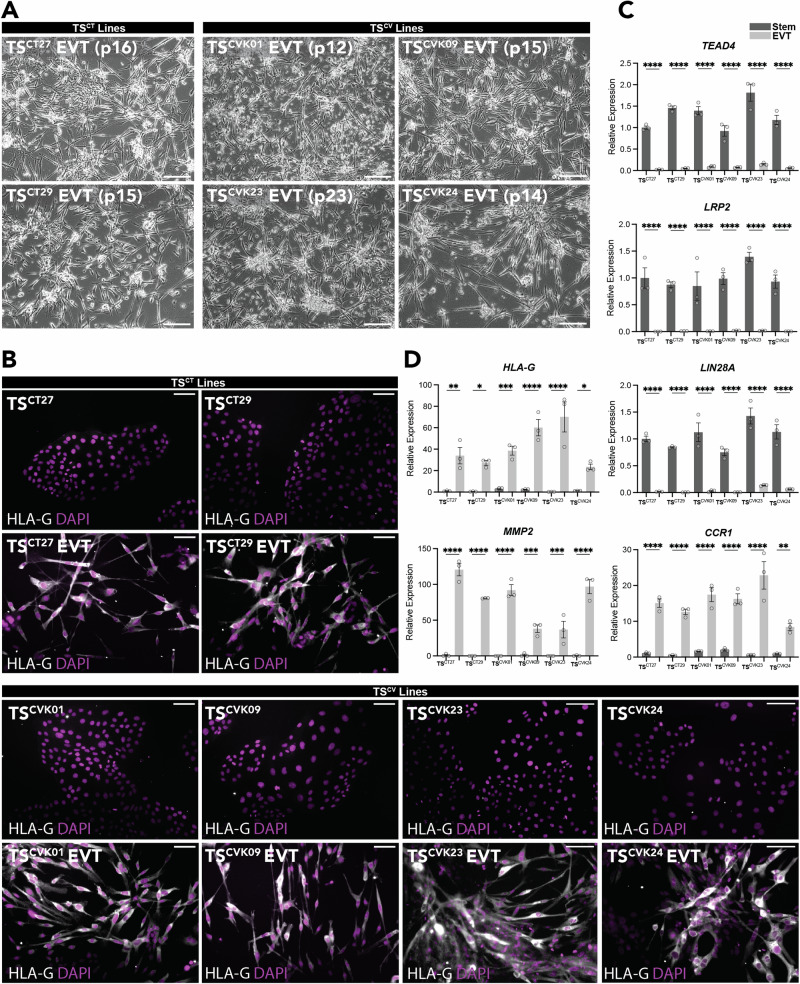
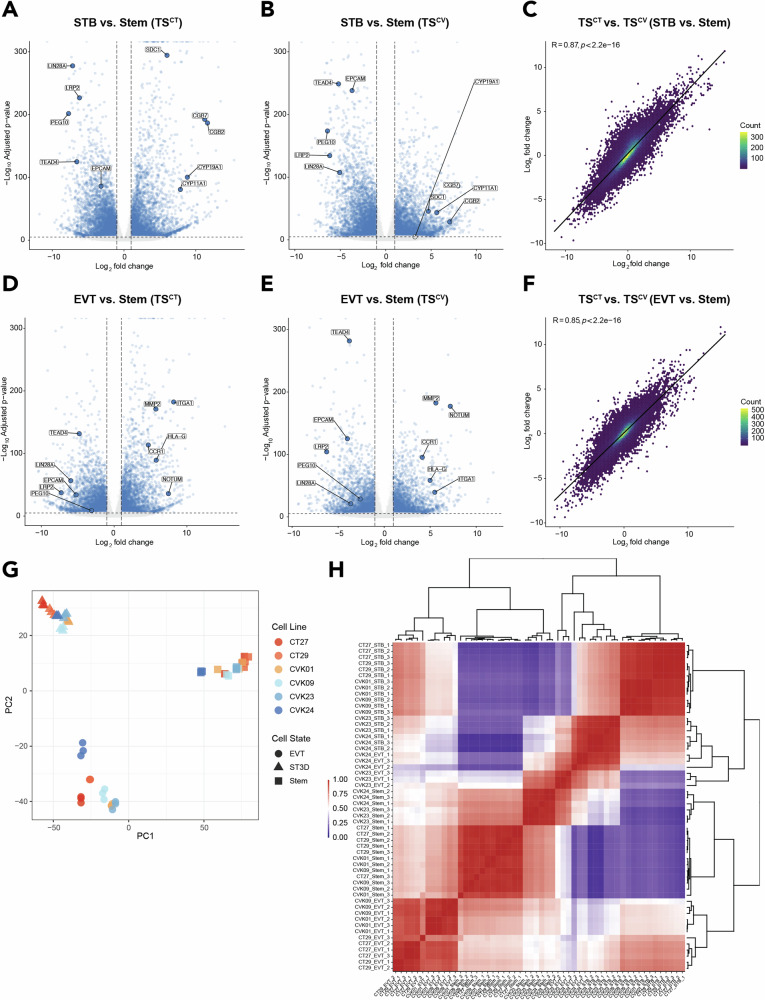
Human trophoblast stem (TS) cells are informative in vitro models for the generation and testing of biologically meaningful hypotheses. The goal of this project was to derive patient-specific TS cell lines from clinically available chorionic villus biopsies. Cell outgrowths were captured from human chorionic villus tissue specimens cultured in modified human TS cell medium. Cell colonies emerged early during the culture and cell lines were established and passaged for several generations. Karyotypes of the newly established chorionic villus-derived trophoblast stem (TSCV) cell lines were determined and compared to initial genetic diagnoses from freshly isolated chorionic villi. Phenotypes of TSCV cells in the stem state and following differentiation were compared to cytotrophoblast-derived TS (TSCT) cells. TSCV and TSCT cells uniformly exhibited similarities in the stem state and following differentiation into syncytiotrophoblast and extravillous trophoblast cells. Chorionic villus tissue specimens provide a valuable source for TS cell derivation. They expand the genetic diversity of available TS cells and are associated with defined clinical outcomes. TSCV cell lines provide a new set of experimental tools for investigating trophoblast cell lineage development.


Conflict of interest statement

Competing interests: The authors declare no competing interests.

Figures

Fig. 1
Fig. 1. Deriving TS cells from chorionic villus tissue specimens.
A Simplified schematic depicting the process of obtaining chorionic villi tissue fragments, derivation of TS cells, and then subsequent differentiation into STB and EVT cell lineages. Created with BioRender.com. B Chorionic villus tissue fragments attach and form cellular outgrowths within a few days of initial plating. Within 1–2 weeks, the outgrowths expand and proliferate across the well. Two to three weeks after plating, the cells were passaged, and colonies emerged. Colony clusters were initially small but proliferated and grew rapidly. Significant heterogeneity is present initially, but subsequent passaging selects for a TS cell population that displays a similar morphology to the original TS cell lines, which possess the ability to differentiate into STB and EVT cell lineages. Scale bars represent 250 μm in the first panel and cropped inset images. All other scale bars represent 500 μm. C An example timeline for TS cell line derivation and characterization.
Fig. 2
Fig. 2. Characterization of TSCV cells.
A Stem state phase contrast images of four chorionic villus-derived TS cell lines (TSCVK01, TSCVK09, TSCVK23, TSCVK24) alongside images of the reference cytotrophoblast-derived TS cell lines (TSCT27 and TSCT29) at different passage numbers (15–21). Scale bars represent 250 μm. B Bar graphs depicting expression of three microRNAs (miR) from the C19MC cluster (hsa-miR-517a-3p, has-miR-517-5p, and hsa-miR-526b-3p) in TSCT and TSCV cell lines relative to induced pluripotent stem (iPS) cells, measured by RT-qPCR. Data were normalized to the control miRNA, hsa-miR-103a-3p. Data are presented as the mean ± SEM. Each dot represents a biological replicate, n = 3 samples per group; *p < 0.05, **p < 0.01, ***p < 0.001, ****p < 0.0001. C Plots representing DNA methylation levels in the ELF5 promoter at 11 sites in TSCT and TSCV cell lines compared to iPS cells. Methylated sites (black) and unmethylated sites (white) are shown for 10 replicates, and the average percent methylation is listed.
Fig. 3
Fig. 3. TSCV cell line differentiation into STB.
A Representative phase contrast images of cytotrophoblast-derived TSCT27 and TSCT29 cells and four chorionic villus-derived TS cell lines possessing a normal karyotype, TSCVK01, TSCVK09, TSCVK23, and TSCVK24 cultured under STB differentiation conditions. Scale bars represent 250 μm. B, C Stem cell-associated transcripts (B; TEAD4, LRP2, and LIN28A) and STB cell-associated transcripts (C; CYP11A1, CGB7, and SDC1) were quantified by RT-qPCR in stem (dark gray) and STB differentiated (gray) TSCT27, TSCT29, TSCVK01, TSCVK09, TSCVK23, and TSCVK24 cells. D Chorionic gonadotropin (CG) protein levels (mlU/mg protein) were quantified by ELISA in cell culture supernatants collected from TSCT and TSCV cultured cells. Data are presented as the mean ± SEM. Each dot represents a biological replicate, n = 3 samples per group; **p < 0.01, ***p < 0.001, ****p < 0.0001.
Fig. 4
Fig. 4. TSCV cell line differentiation into EVT cells.
A Representative phase contrast images of cytotrophoblast-derived TSCT27 and TSCT29 cells and four chorionic villus-derived TS cell lines possessing a normal karyotype, TSCVK01, TSCVK09, TSCVK23, and TSCVK24 cells cultured under EVT cell differentiation conditions. Scale bars represent 250 μm. B Immunofluorescence detection of HLA-G (gray) by immunocytochemistry in TSCT and TSCV cells cultured in the stem state and on day 8 of EVT cell differentiation. DAPI (magenta) stains cell nuclei. Scale bars represent 100 μm. C, D Stem cell-associated transcripts (C; TEAD4, LRP2, and LIN28A) and EVT cell-associated transcripts (D; HLA-G, MMP2, and CCR1) were quantified by RT-qPCR in stem (dark gray) and EVT differentiated (gray) TSCT27, TSCT29, TSCVK01, TSCVK09, TSCVK23, and TSCVK24 cells. Data are presented as the mean ± SEM. Each dot represents a biological replicate, n = 3 samples per group; *p < 0.05, **p < 0.01, ***p < 0.001, ****p < 0.0001.
Fig. 5
Fig. 5. TSCV and TSCT cells cluster by cell state and share similar transcriptomes.
A, B Volcano plots depicting significantly up- and downregulated genes based on transcripts measured by RNA-seq in STB versus stem cell states in TSCT (A) and TSCV (B) cells. Gene transcript levels unchanged between STB and stem state cells are depicted in gray (n = 3 per group; absolute Log2 fold change >1, adjusted p < 0.05). C Two-dimensional density plot comparing gene expression changes between STB and stem cell states in TSCT (TSCT27 and TSCT29) cells versus TSCV (TSCVK01, TSCVK09, TSCVK23, and TSCVK24) cells (Pearson correlation coefficient (R) = 0.87, p < 2.2e-16). D, E Volcano plots depicting significantly up- and downregulated genes based on transcripts measured by RNA-seq in EVT versus stem cell states in TSCT (D) and TSCV (E) cells. Gene transcript levels unchanged between EVT and stem cell states are depicted in gray (n = 3 per group; absolute Log2 fold change >1, adjusted p < 0.05). F Two-dimensional density plot comparing gene expression changes between EVT and stem cell states in TSCT (TSCT27 and TSCT29) cells versus TSCV (TSCVK01, TSCVK09, TSCVK23, and TSCVK24) cells. Pearson correlation coefficient (R) = 0.85, p < 2.2e-16. G Principal component analysis based on RNA-seq datasets generated from TSCT and TSCV cells cultured in the stem state or following differentiation into STB and EVT cell lineages. H Heat map showing scaled normalized read counts representing gene expression profiles of stem state, STB, and EVT differentiated cells across TSCT and TSCV cell lines.

Update of

Similar articles

References

    1. Amoroso, E. C. The evolution of viviparity. Proc. R. Soc. Med.61, 1188–1200 (1968). - PMC - PubMed
    1. Knöfler, M. et al. Human placenta and trophoblast development: key molecular mechanisms and model systems. Cell Mol. Life Sci.76, 3479–3496 (2019). - PMC - PubMed
    1. Soares, M. J., Varberg, K. M. & Iqbal, K. Hemochorial placentation: development, function, and adaptations. Biol. Reprod.99, 196–211 (2018). - PMC - PubMed
    1. Turco, M. Y. & Moffett, A. Development of the human placenta. Development146, dev163428 (2019). - PubMed
    1. Rossant, J. & Tam, P. P. L. New insights into early human development: lessons for stem cell derivation and differentiation. Cell Stem Cell20, 18–28 (2017). - PubMed

LinkOut - more resources