. 2025 Jul 1;15(1):20778.
doi: 10.1038/s41598-025-06812-1.

CXCL10-induced regulatory T cells and adenosine signaling promote immunosuppression and progression of epithelial ovarian cancer

Affiliations

CXCL10-induced regulatory T cells and adenosine signaling promote immunosuppression and progression of epithelial ovarian cancer

Annabelle C Lin et al. Sci Rep. .

Erratum in

Abstract

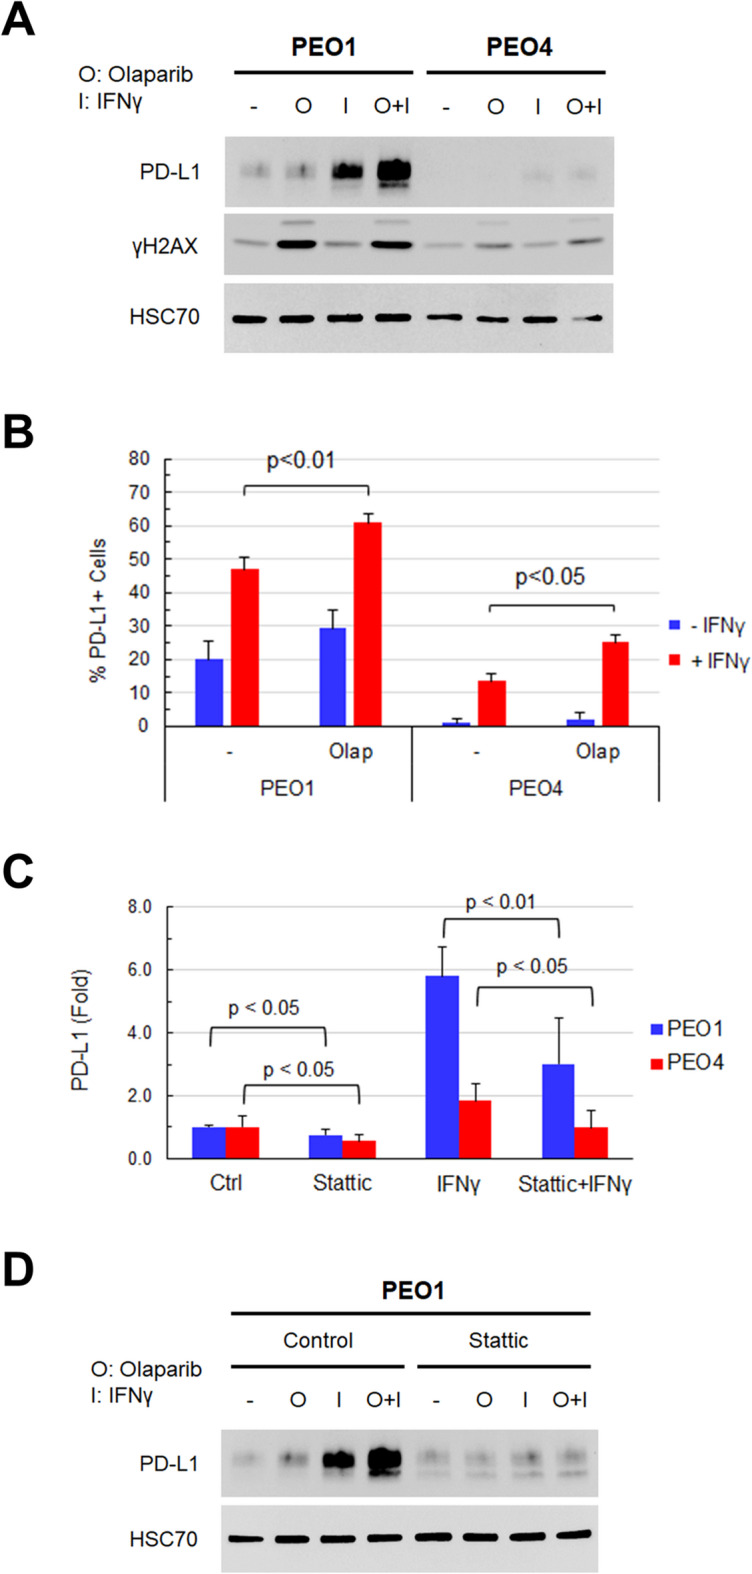
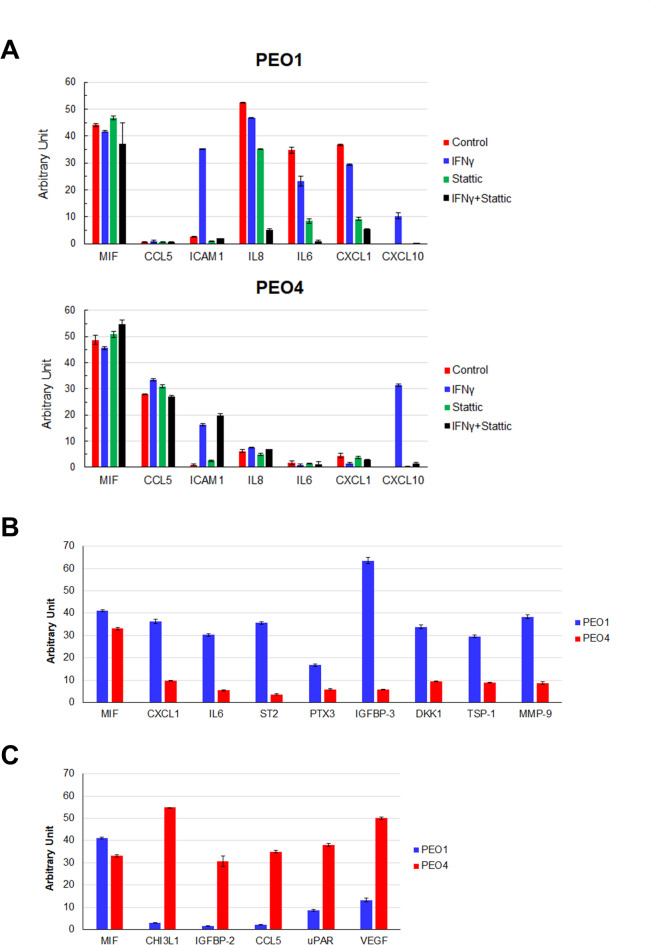
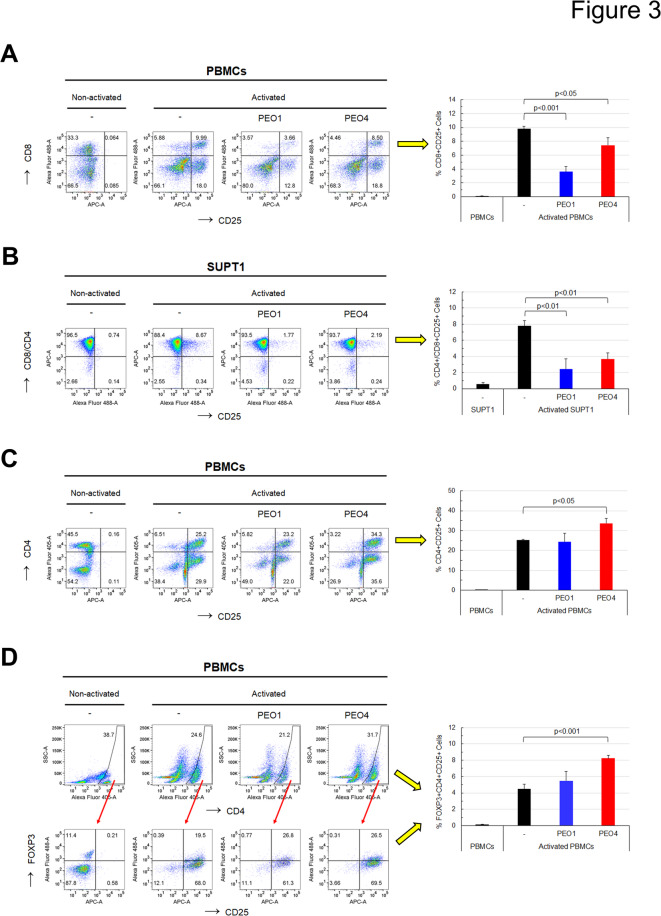
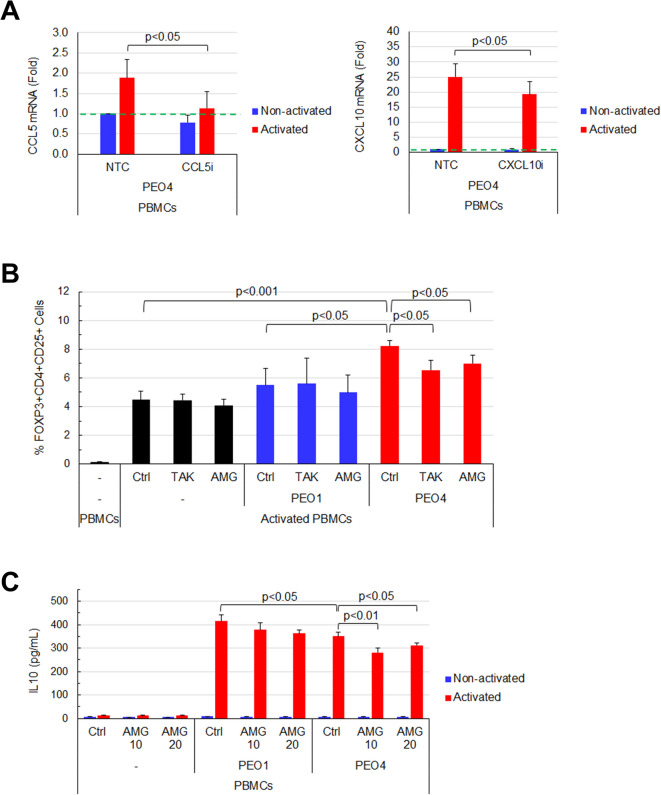
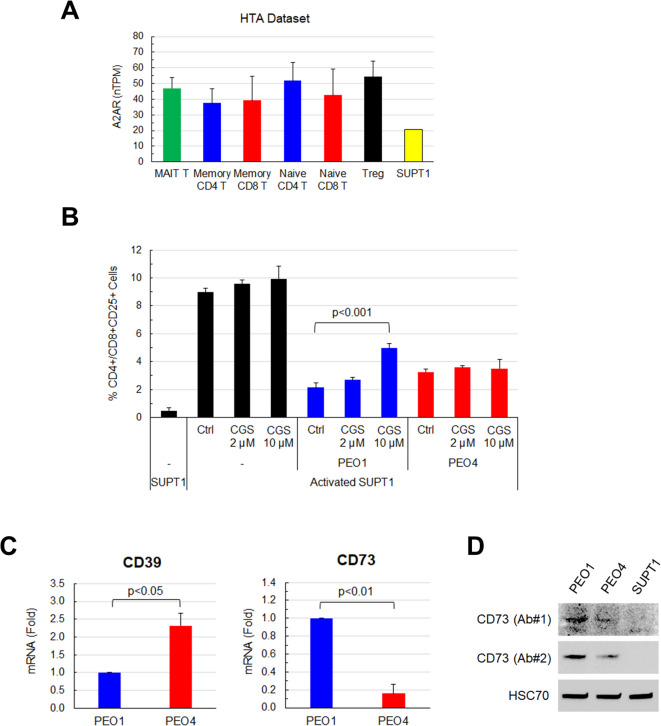
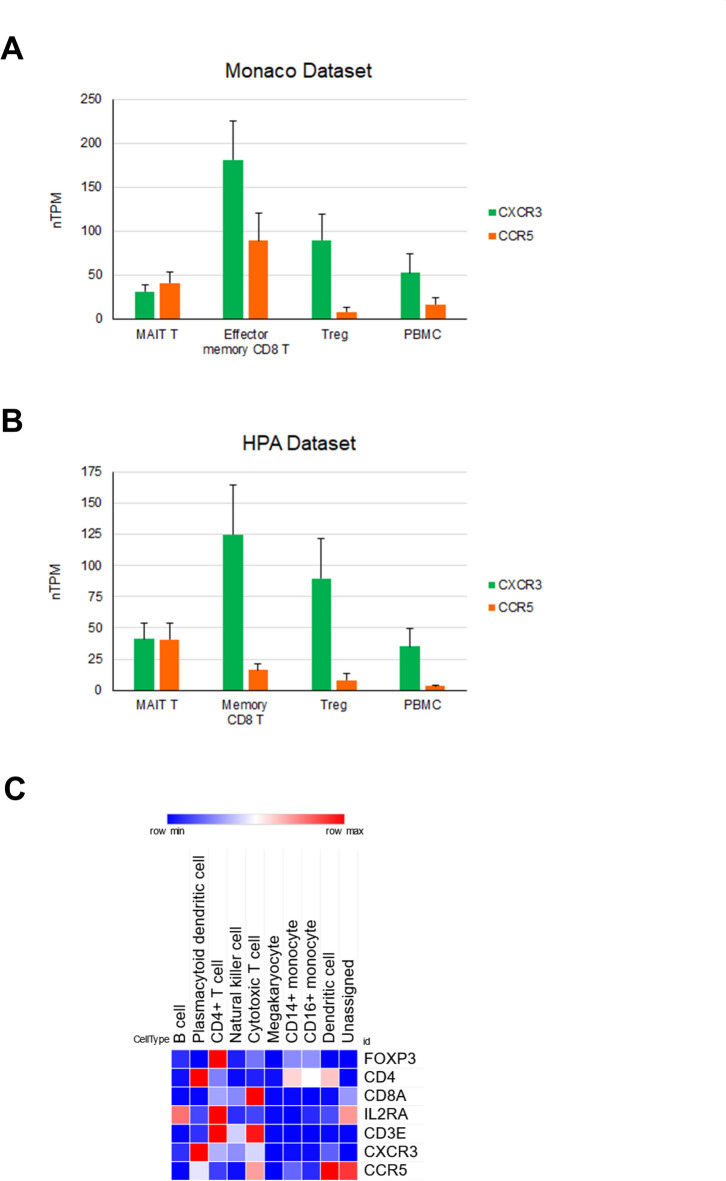
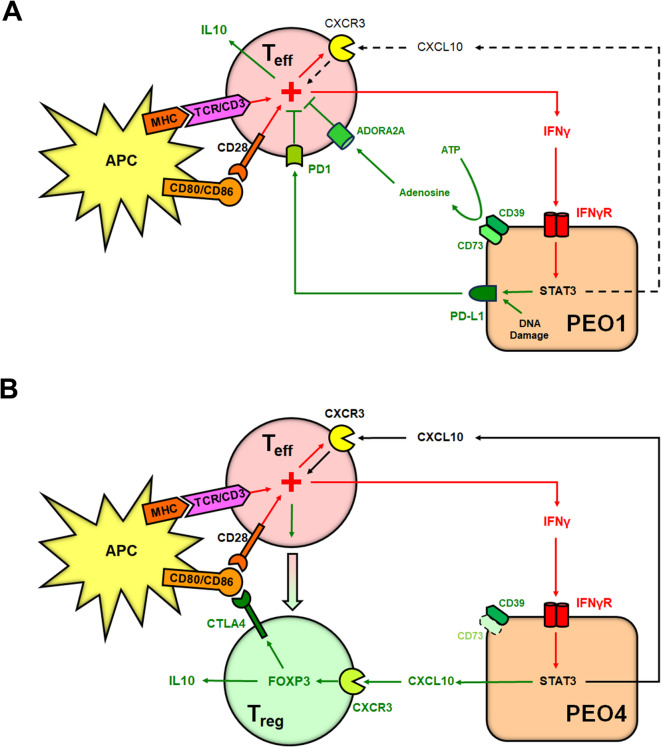
Epithelial ovarian cancer (EOC) is characterized by a highly immunosuppressive tumor microenvironment (TME) that enables EOC progression and limits the efficacy of current immunotherapies. In this study, we demonstrated that isogenic BRCA2-mutated PEO1 and BRCA2-wild type PEO4 EOC cells induced immunosuppressive TMEs through distinct mechanisms. PEO1 cells produced IFNγ-induced PD-L1 and expressed CD39 and CD73 for generating adenosine. Treatment with the adenosine antagonist CGS15943 reversed PEO1 cell-mediated suppression of effector T cell activation. In contrast, PEO4 cells secreted IFNγ-induced CXCL10 and promoted up-regulation of FOXP3+ regulatory T cells (Tregs). Treatment with the CXCL10/CXCR3 antagonist AMG487 attenuated PEO4 cell-induced Tregs and decreased IL10 production. In vivo, administration of a monoclonal antibody against CXCR3 effectively hindered the progression of tumor ascites and prolonged survival in the p53(-/-) ID8 EOC syngeneic mouse model. Additionally, AMG487 treatment synergized with the VEGFA inhibitor bevacizumab, significantly reducing tumor ascites and extending mouse survival. Collectively, our results reveal that EOC leverages CXCL10-induced Tregs or adenosine signaling to dampen T cell-mediated anti-cancer immune responses. These findings suggest that targeting CXCL10/CXCR3 and adenosine signaling could effectively counter immunosuppression of EOC, offering a promising therapeutic strategy for improving patient outcomes.

Keywords: Adenosine; CXCL10; CXCR3; Epithelial ovarian cancer; Immunosuppression; Regulatory T cells.


Conflict of interest statement

Declarations. Competing interests: The authors declare no competing interests.

Figures

Fig. 1
Fig. 1
Expression of PD-L1 in PEO1 and PEO4 cells. Cells were treated with 10 µM olaparib, 20 ng/mL IFNγ, or both in combination for 24 h. Total protein was analyzed by western blotting for PD-L1, γH2AX, and HSC70. γH2AX was used to confirm olaparib-induced DNA damage. HSC70 was used as a loading control (A). Cells were stained with an anti-PD-L1 antibody and analyzed by a flow cytometer. PD-L1-positive cell populations were gated to determine the percentage of PD-L1-positive cells (B). PEO1 and PEO4 cells were transfected with the PD-L1 luciferase reporter plasmid and the renilla luciferase control plasmid for 24 h and then treated with IFNγ, stattic, or both in combination for 24 h. The firefly luciferase level was normalized to that of the renilla luciferase to determine the fold changes in PD-L1 promoter activity (C). Data are means ± SD (n = 3) from three independent experiments. Cells were treated with olaparib, IFNγ, or both in combination without and with stattic for 24 h. Total protein was analyzed by western blotting for PD-L1 and HSC70 (D).
Fig. 2
Fig. 2
Cytokine profiling of conditioned media from PEO1 and PEO4 cells. PEO1 and PEO4 cells were treated with IFNγ, stattic, or both in combination for 24 h. Conditioned media were collected to determine the levels of 36 cytokines using a cytokine immunoarray. The levels of representative cytokines produced by PEO1 and PEO4 cells are shown (A). Conditioned media of PEO1 and PEO4 cells under normal growth conditions after 24 h were collected to determine the levels of 105 cytokines using a cytokine immunoarray. The levels of cytokines over-produced by PEO1 cells (B) or by PEO4 cells (C) were shown. PEO1 and PEO4 cells produced comparable levels of MIF, which are also demonstrated. Data are means ± SD (n = 2) of duplicate measurements from a representative experiment.
Fig. 3
Fig. 3
Immunosuppressive effects of PEO1 and PEO4 cells on PBMCs and SUPT1 cells. PBMCs or SUPT1 cells activated by CD3/CD28 antibodies were co-cultured with PEO1 or PEO4 cells for 48 h. PBMCs were collected, stained, and analyzed by a flow cytometer to determine the percentage of the CD8+CD25+ T cell population in PBMCs (A) and in SUPT1 cells (B), as well as the percentage of the CD4+CD25+ T cell population in PBMCs (C). To determine the level of the Treg population, PBMCs were first gated for CD4+ cells to determine the percentage of the CD4+ T cell population in PBMCs (Top). The CD4+ T cell population was subsequently gated for FXOP3+CD25+ cells to determine the percentage of FOXP3+CD25+ T cells in the CD4+ T cell population (bottom). The bar graph shows the percentage of FOXP3+CD4+CD25+ T cells in PBMCs by calculating FOXP3+CD25+ T cells of CD4+ T cells of total PBMCs (D). Data are means ± SD (n = 3) from three independent experiments.
Fig. 4
Fig. 4
Effects of EOC cell-produced CCL5 and CXCL10 on the level of Tregs in PBMCs. PEO4 cells were transfected with non-targeted control (NTC)- and CCL5- or CXCL10-siRNA for 24 h and then co-cultured with CD3/CD28 antibodies-activated PBMCs for 48 h. Total RNA from PEO4 cells was analyzed by quantitative RT-PCR for CCL5 and CXCL10 mRNA expression (A) Effects of CCL5 and CXCL10 blockade on the level of Tregs in PBMCs. PBMCs were activated by anti-CD3/CD28 antibodies and co-cultured with PEO1 or PEO4 cells for 48 h in the presence of 10 µM TAK779 or AMG487. PBMCs were collected, stained, and analyzed by a flow cytometer. CD4+ cells were gated to further determine the percentage of the FOXP3+CD4+CD25+ Treg population. Data are means ± SD (n = 3) from three independent experiments (B). Effects of CXCL10 blockade on IL10 production by PBMCs. PBMCs were activated by anti-CD3/CD28 antibodies and co-cultured with PEO1 or PEO4 cells for 48 h in the absence or presence of 10 and 20 µM AMG487. Conditioned media were collected for analysis of IL10 produced by PBMCs cells using ELISA. Data are means ± SD (n = 3) from a representative experiment (C).
Fig. 5
Fig. 5
Effects of adenosine signaling blockade on effector T cells. Expression of A2AR in T cell subsets in PBMCs and SUPT1 cells. Levels of A2AR RNA expression (nTPM) were compared, using the HTA datasets (n = 5–6) and the leukemia cell line data from the Human Protein Atlas. (A). Effects of adenosine signaling blockade on SUPT1 cell activation. SUPT1 cells were activated by anti-CD3/CD28 antibodies and co-cultured with PEO1 or PEO4 cells for 48 h in the presence of 2 and 10 µM CGS15943. SUPT1 cells were collected, stained, and analyzed by a flow cytometer to determine the percentage of the CD4+/CD8+CD25+ population (B). The levels of CD39 and CD73 expression in PEO1 and PEO4 cells. Total RNA was analyzed by quantitative RT-PCR for the levels of CD39 and CD73 mRNA. Data are means ± SD (n = 3) from three independent experiments. The levels of CD73 protein in PEO1, PEO4, and SUPT1 cells. Total protein was analyzed by western blotting (C).
Fig. 6
Fig. 6
CXCR3 and CCR5 expression in T cell subsets in human PBMCs. Levels of CXCR3 and CCR5 RNA expression (nTPM) in MAIT T cells, CD8 T cells, Tregs, and PBMCs were shown, using the Monaco (n = 4–13) (A) and HPA (n = 5–6) (B) datasets from the Human Protein Atlas. MAIT, mucosal-associated invariant T cells. Heatmap of RNA expression levels of T cell markers, CXCR3, and CCR5 in various immune cell types. The color indicates the level of scaled mean RNA expression. The heat map was generated from the dataset of the Single Cell Portal. CD3E is used as a T cell marker to highlight CD8+ cytotoxic T cells and CD4+ (or FOXP3+) T cells (C).
Fig. 7
Fig. 7
Efficacy of CXCR3 blockade on peritoneal progression of p53(-/-) ID8 EOC and the survival of C57BL6 mice. Mice (Control group, n = 5; CXCR3 mAb group, n = 4) were inoculated ip with ID8 cells and treated ip with vehicle or CXCR3 mAb for 5 weeks. The ACs of mice were measured to determine the percentage increase in AC. The body weight of mice was measured to monitor treatment toxicity (A). The Kaplan-Meier survival curve and median survival time of mice were determined using a 50% increase in AC as the endpoint (B). Mice (n = 5) were inoculated ip with ID8 cells and treated ip with vehicle, AMG487, bevacizumab (Bev), or both in combination for 5 weeks. Bev group, n = 4. The ACs of mice were measured to determine the percentage increase in AC. The body weight of mice was measured to monitor treatment toxicities. Data are means ± SD.*, p < 0.05; **, p < 0.01 (C). The Kaplan-Meier survival curve and median survival time of mice were determined using a 50% increase in AC as the endpoint. p values are shown (D). Mice (n = 5 and n = 3 from two experiments) inoculated ip with ID8 cells were treated with vehicle or AMG487 for 5 weeks. When mice reached the survival endpoint, tumor ascites was obtained and CD3+ T cells were isolated, stained, and analyzed by a flow cytometer to determine the percentages of activated CD8+ T cells and FOXP3+CD4+ Tregs in total CD3+ T cells. Each dot represents the value of an individual mouse. Means and SD of all mice in each treatment group, and p values are shown (E).
Fig. 8
Fig. 8
Proposed mechanisms of immunosuppression caused by PEO1 and PEO4 cells. APC(CD3/CD28)-mediated effector T cell activation produces IFNγ that triggers different responses in PEO1 and PEO4 cells. PEO1 cells express PD-L1 in response to IFNγ and generate adenosine via CD39 and CD73 to attenuate effector T cell activation (A). In contrast, PEO4 cells respond to IFNγ by producing CXCL10 to up-regulate and maintain FOXP3+ Tregs. In turn, Tregs exert suppressive effects by producing IL10 and expressing CTLA4 (B). Dashed lines indicate weak or minor signaling events. APC, antigen presenting cells.

References

    1. Siegel, R. L., Miller, K. D., Fuchs, H. E., Jemal, A. & Cancer statistics CA: A Cancer Journal for Clinicians 72, 7–33, (2022). 10.3322/caac.21708 (2022). - PubMed
    1. Kim, R., Emi, M., Tanabe, K. & Arihiro, K. Tumor-Driven evolution of immunosuppressive networks during malignant progression. Cancer Res.66, 5527–5536 (2006). - PubMed
    1. Zhang, Y. & Zheng, J. in Regulation of Cancer Immune Checkpoints: Molecular and Cellular Mechanisms and Therapy (ed Jie Xu) 201–226Springer Singapore, (2020).
    1. Spranger, S. & Gajewski, T. F. Mechanisms of tumor Cell–Intrinsic immune evasion. Annual Rev. Cancer Biology. 2, 213–228. 10.1146/annurev-cancerbio-030617-050606 (2018).
    1. Wei, S. C., Duffy, C. R. & Allison, J. P. Fundamental mechanisms of immune checkpoint Blockade therapy. Cancer Discov.8, 1069–1086. 10.1158/2159-8290.cd-18-0367 (2018). - PubMed

MeSH terms