

Combined effects of metformin and coenzyme Q10 on doxorubicin-induced cardiotoxicity in male wistar rats
- PMID: 40596564
- PMCID: PMC12214982
- DOI: 10.1038/s41598-025-07576-4
Combined effects of metformin and coenzyme Q10 on doxorubicin-induced cardiotoxicity in male wistar rats
Abstract
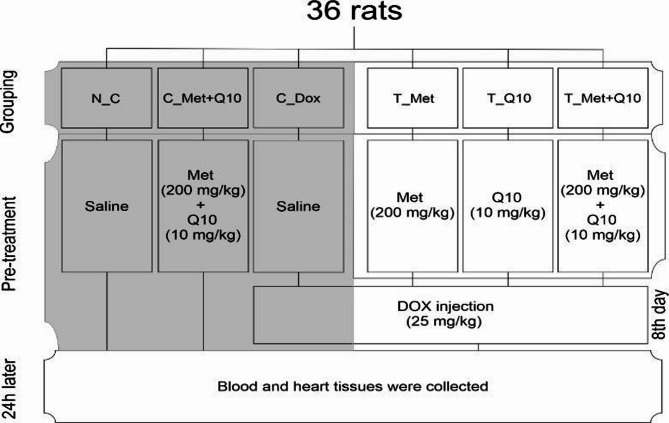
Doxorubicin (DOX) is an effective anticancer drug, but its clinical application is limited due to its severe adverse effects on multiple organs and tissues, particularly cardiotoxicity. Studies suggest that metformin and Coenzyme Q10 (CoQ10) may help reduce DOX-induced cardiotoxicity. This study investigated the individual and combined effects of metformin and CoQ10 on DOX-induced cardiotoxicity in rats. 36 male Wistar rats were divided into six groups consisting of N_C, C_Dox (25 mg/kg DOX), C_(Met + Q10) (200 mg/kg metformin + 10 mg/kg CoQ10), T_Met (200 mg/kg metformin + 25 mg/kg DOX), T_Q10 (10 mg/kg CoQ10 + 25 mg/kg DOX), and T_(Met + Q10) (200 mg/kg metformin + 10 mg/kg CoQ10 + 25 mg/kg DOX). DOX administration significantly elevated serum CK-MB, LDH (P < 0.05), and tissue MDA (P < 0.001). It also significantly decreased TAC, CAT, GPx (P < 0.001), and SOD (P < 0.01) in heart tissues. Treatment with metformin and CoQ10 significantly restored the biochemical parameters both in the serum and tissue samples and ameliorated the histopathological damage caused by DOX. In conclusion, the combination of metformin and CoQ10 exerted antioxidant and cardioprotective effects against DOX-induced cardiotoxicity.
Keywords: Cardioprotection; Cardiotoxicity; Coenzyme Q10; Doxorubicin; Metformin.
© 2025. The Author(s).
Conflict of interest statement
Declarations. Competing interests: The authors declare no competing interests. Conflict of interest: The authors report no conflicts of interest. Ethical approval: This study was approved by the Ardabil University of Medical Sciences (Ethics code: IR.ARUMS.AEC.1402.004).
Figures


Similar articles
-
Metformin alleviates doxorubicin-induced hepatic damage by modulating oxidative stress: a molecular, biochemical, and histopathological approach in a rat model.Naunyn Schmiedebergs Arch Pharmacol. 2025 Jul;398(7):9099-9107. doi: 10.1007/s00210-024-03688-2. Epub 2025 Feb 4. Naunyn Schmiedebergs Arch Pharmacol. 2025. PMID: 39903256
-
β-LAPachone ameliorates doxorubicin-induced cardiotoxicity via regulating autophagy and Nrf2 signalling pathways in mice.Basic Clin Pharmacol Toxicol. 2020 Apr;126(4):364-373. doi: 10.1111/bcpt.13340. Epub 2019 Nov 27. Basic Clin Pharmacol Toxicol. 2020. PMID: 31630478
-
Evaluation of the Effect of Virgin Rice Bran Oil (VRBO) on Doxorubicininduced Cardiotoxicity in Wistar Rats.Curr Cardiol Rev. 2025;21(4):e1573403X327970. doi: 10.2174/011573403X327970250108045235. Curr Cardiol Rev. 2025. PMID: 39878106
-
Corticosteroids for the treatment of Duchenne muscular dystrophy.Cochrane Database Syst Rev. 2016 May 5;2016(5):CD003725. doi: 10.1002/14651858.CD003725.pub4. Cochrane Database Syst Rev. 2016. PMID: 27149418 Free PMC article.
-
Optimizing dose selection for doxorubicin-induced cardiotoxicity in mice: A comprehensive analysis of single and multiple-dose regimens.Eur J Pharmacol. 2025 Sep 15;1003:177883. doi: 10.1016/j.ejphar.2025.177883. Epub 2025 Jul 2. Eur J Pharmacol. 2025. PMID: 40615106
References
-
- Ferlay, J. et al. Cancer statistics for the year 2020: an overview. Int. J. Cancer. 149, 778–789 (2021). - PubMed
-
- Curigliano, G. et al. Cardiotoxicity of anticancer treatments: epidemiology, detection, and management. Cancer J. Clin.66, 309–325 (2016). - PubMed
-
- Fitzmaurice, C. et al. Global, regional, and National cancer incidence, mortality, years of life lost, years lived with disability, and disability-adjusted life-years for 29 cancer groups, 1990 to 2016: a systematic analysis for the global burden of disease study. JAMA Oncol.4, 1553–1568 (2018). - PMC - PubMed
-
- Soerjomataram, I. & Bray, F. Planning for tomorrow: global cancer incidence and the role of prevention 2020–2070. Nat. Reviews Clin. Oncol.18, 663–672 (2021). - PubMed
-
- Ewer, M. S. & Ewer, S. M. Cardiotoxicity of anticancer treatments. Nat. Reviews Cardiol.12, 547–558 (2015). - PubMed
MeSH terms
Substances
LinkOut - more resources
Full Text Sources
Research Materials
Miscellaneous
