

The effects of voltage dependence and ion-binding reaction rates on a thermodynamically constrained mathematical model of the Na/Ca exchanger
- PMID: 40596613
- PMCID: PMC12216051
- DOI: 10.1038/s41598-025-07881-y
The effects of voltage dependence and ion-binding reaction rates on a thermodynamically constrained mathematical model of the Na/Ca exchanger
Abstract
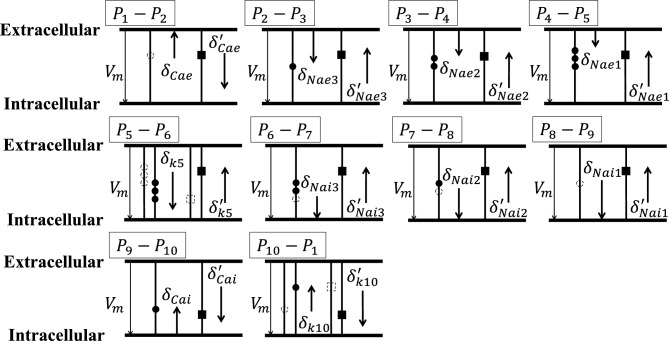
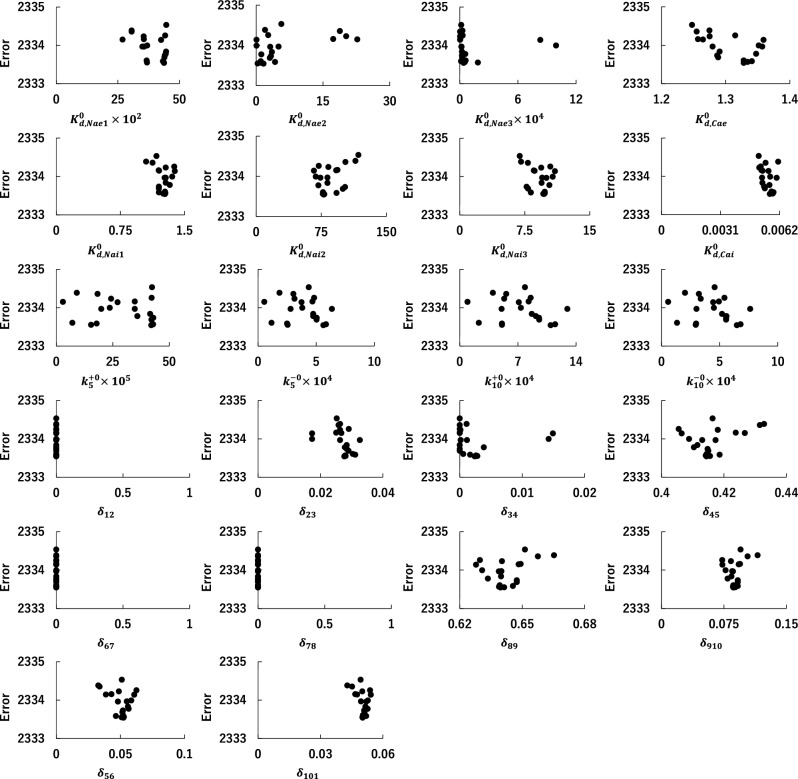
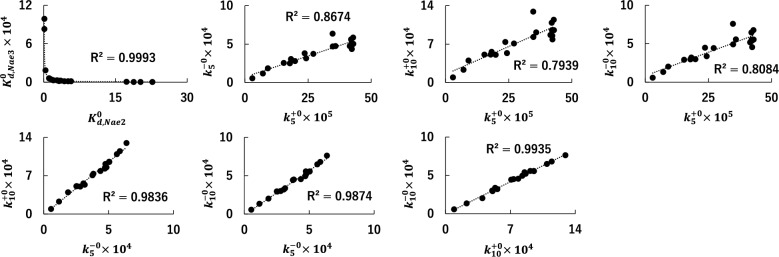
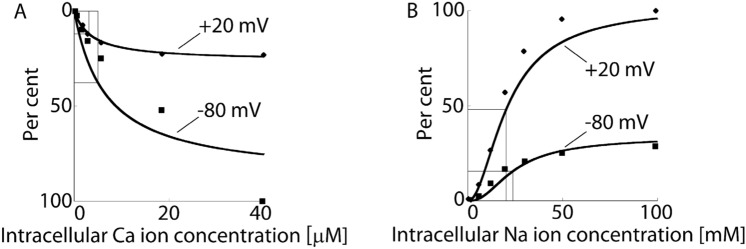
Specialized mathematical models have been proposed to quantitatively assess the ion transporter performance in heart-related physiological experiments. The Na/Ca exchanger imports three Na+ ions into the cell and exports one Ca2+ ion; therefore, it plays a vital role in cardiomyocyte ion homeostasis. The detailed characteristics of the voltage and ion concentration dependencies of the exchanger current were reported by Matsuoka and Hilgemann in 1992, whereas existing mathematical models can only reproduce a limited range of experimental data. This study primarily focuses on the development of a new mathematical model by introducing charge movements to all consecutive state transition processes under thermodynamic constraints, which accomplish voltage dependencies and current generation for each ion binding and dissociation process. The proposed model includes 22 charge movement, dissociation constant, and rate constant parameters, which were optimized to fit the voltage and ion concentration dependencies of the steady-state transporter currents. Through this process, most parameters converged effectively. Using the optimal parameters, our model successfully replicated the experimental steady-state current data as well as the transient current data. This underscores the accuracy and reliability of our model for reflecting the complex dynamics of cardiomyocyte electrophysiology.
Keywords: Charge Transfer; Mathematical Model; Na/Ca Exchanger; Thermodynamics; Voltage Dependence.
© 2025. The Author(s).
Conflict of interest statement
Declarations. Competing interests: The authors declare no competing interests.
Figures


Similar articles
-
Electrodiffusion dynamics in the cardiomyocyte dyad at nano-scale resolution using the Poisson-Nernst-Planck (PNP) equations.PLoS Comput Biol. 2025 Jun 12;21(6):e1013149. doi: 10.1371/journal.pcbi.1013149. eCollection 2025 Jun. PLoS Comput Biol. 2025. PMID: 40505081 Free PMC article.
-
A rapid and systematic review of the clinical effectiveness and cost-effectiveness of paclitaxel, docetaxel, gemcitabine and vinorelbine in non-small-cell lung cancer.Health Technol Assess. 2001;5(32):1-195. doi: 10.3310/hta5320. Health Technol Assess. 2001. PMID: 12065068
-
The clinical effectiveness and cost-effectiveness of enzyme replacement therapy for Gaucher's disease: a systematic review.Health Technol Assess. 2006 Jul;10(24):iii-iv, ix-136. doi: 10.3310/hta10240. Health Technol Assess. 2006. PMID: 16796930
-
Dexamethasone disrupts intracellular pH homeostasis to delay coronavirus infectious bronchitis virus cell entry via sodium hydrogen exchanger 3 activation.J Virol. 2025 Jun 17;99(6):e0189424. doi: 10.1128/jvi.01894-24. Epub 2025 May 9. J Virol. 2025. PMID: 40340398 Free PMC article.
-
Health professionals' experience of teamwork education in acute hospital settings: a systematic review of qualitative literature.JBI Database System Rev Implement Rep. 2016 Apr;14(4):96-137. doi: 10.11124/JBISRIR-2016-1843. JBI Database System Rev Implement Rep. 2016. PMID: 27532314
References
-
- Luo, C. H. & Rudy, Y. A dynamic model of the cardiac ventricular action potential. I. Simulations of ionic currents and concentration changes. Circ. Res.74(6), 1071–1096 (1994). - PubMed
-
- Luo, C. H. & Rudy, Y. A dynamic model of the cardiac ventricular action potential. II. Afterdepolarizations, triggered activity, and potentiation. Circ. Res.74(6), 1097–1113 (1994). - PubMed
-
- Matsuoka, S., Sarai, N., Kuratomi, S., Ono, K. & Noma, A. Role of individual ionic current systems in ventricular cells hypothesized by a model study. Jpn. J. Physiol.53(2), 105–123 (2003). - PubMed
MeSH terms
Substances
LinkOut - more resources
Full Text Sources
Miscellaneous
