. 2025 Jul 1;15(1):21117.
doi: 10.1038/s41598-025-08486-1.

Effects of Paeoniae Radix Rubra on lowering lipid via bioinformatics and gut microbiome

Affiliations

Effects of Paeoniae Radix Rubra on lowering lipid via bioinformatics and gut microbiome

Zhi Lin et al. Sci Rep. .

Abstract

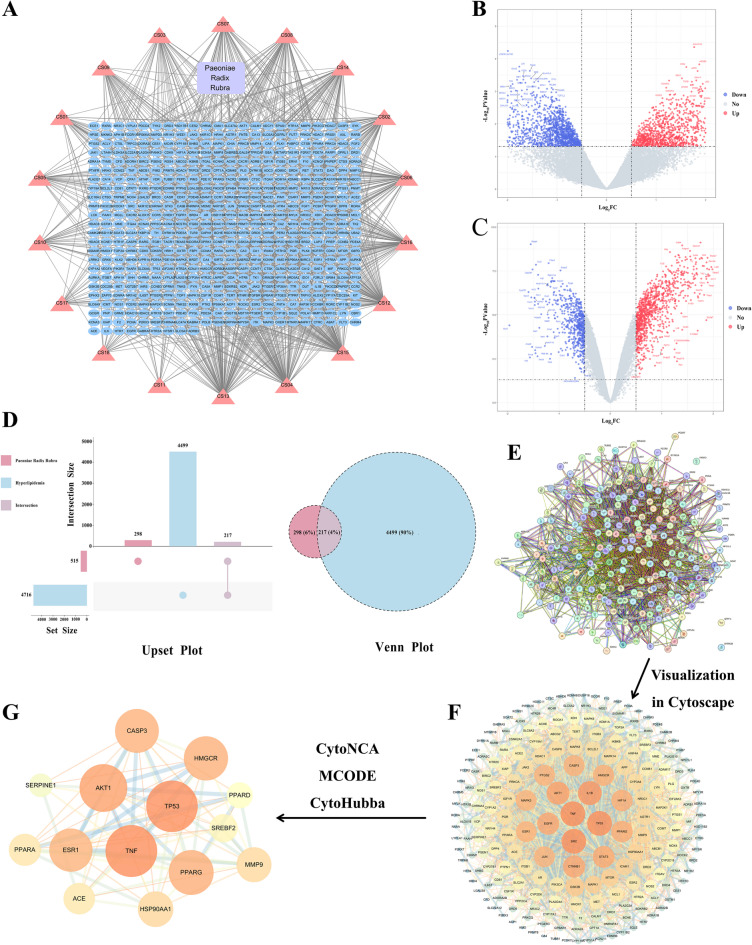
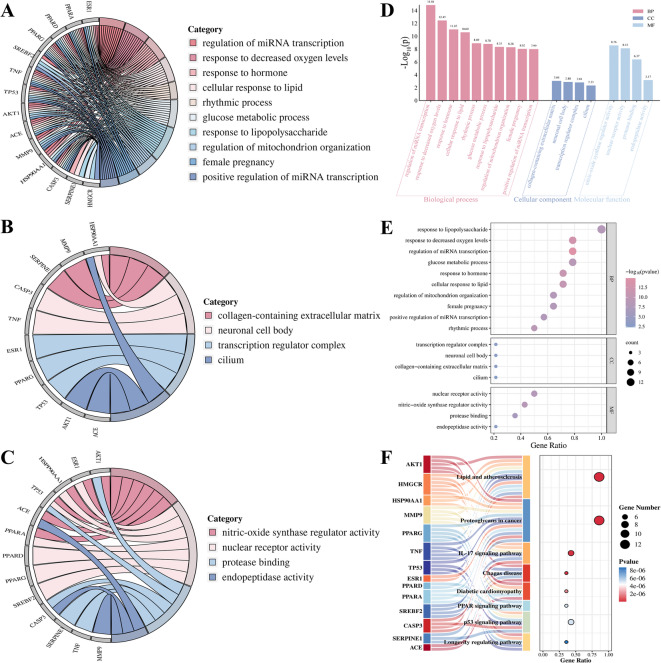
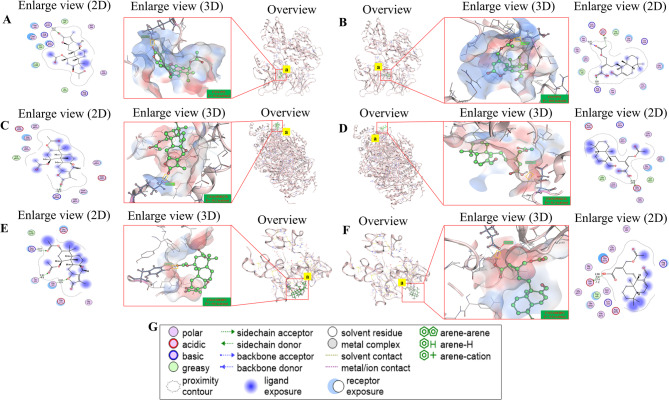
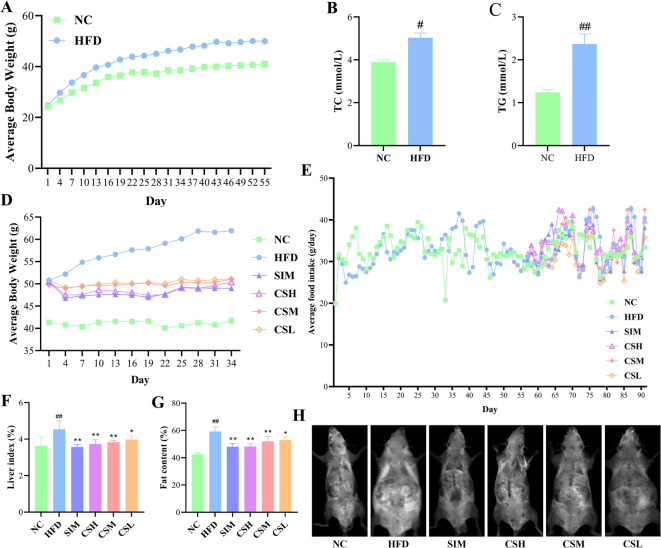
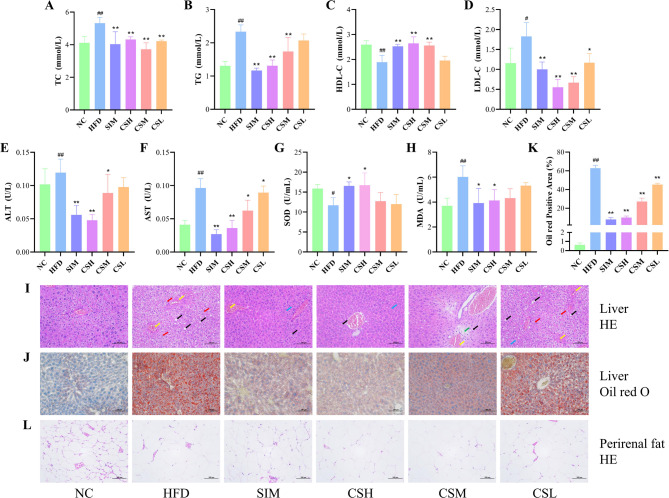
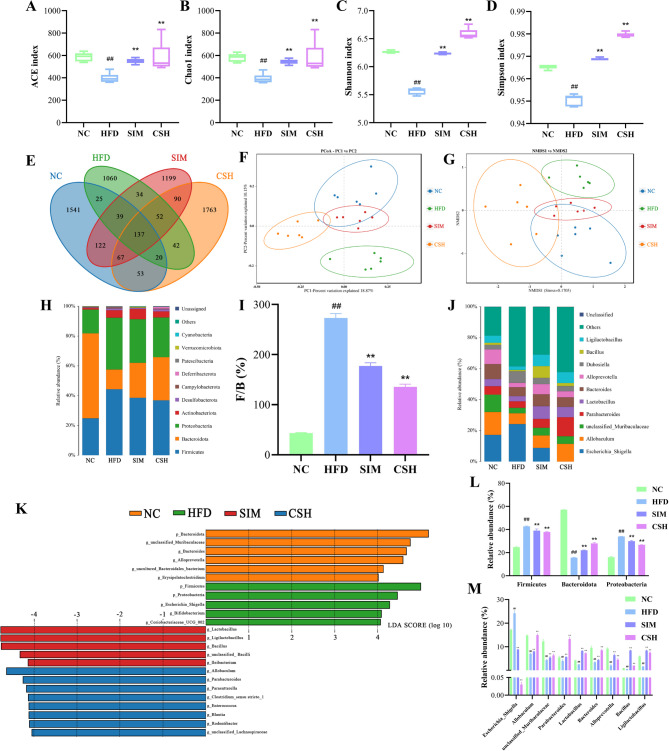
Hyperlipidemia, a metabolic disorder characterized by abnormal lipid levels, is closely linked to an increased risk of cardiovascular disease. In this study, we investigated the hypolipidemic properties of Paeoniae Radix Rubra and its regulatory effects on gut microbiota composition in a high-fat diet model. Using UHPLC-QE-MS/MS, we identified its chemical constituents and applied bioinformatics, network pharmacology, and molecular docking to virtually screen for bioactive compounds and molecular targets. Gelomulide N and (E)-5-[(1 S,4aR,8aR)-2-formyl-5,5,8a-trimethyl-1,4,4a,6,7,8-hexahydronaphthalen-1-yl]-3-(acetoxymethyl)pent-2-enoic acid were identified as potential active compounds. Paeoniae Radix Rubra exhibited notable hypolipidemic, hepatoprotective, and gut microbiota-restoring effects, potentially influencing the mevalonate pathway by interacting with proteins such as P53, HMGCR, and SREBP2, which may contribute to reduced cholesterol synthesis. These findings indicate that the Paeoniae Radix Rubra could serve as a potential therapeutic strategy for hyperlipidemia, possibly mediated through modulation of lipid metabolism pathways and gut microbiota remodeling.

Keywords: Paeoniae Radix Rubra; Bioinformatics; Gut microbiota; Hyperlipidemia; Mevalonate pathway.


Conflict of interest statement

Declarations. Competing interests: The authors declare no competing interests. Ethics approval: All animal experiments followed ARRIVE guidelines and the NIH Guide for the Care and Use of Laboratory Animals (NIH Publication No. 8023, revised 1978) and the Experimental Animal Ethics Committee of Changchun University of Chinese Medicine (Ethics Approval No.: 2020262).

Figures

Fig. 1
Fig. 1
Core Target Screening for PRR in the Treatment of Hyperlipidemia. (A) The network topology diagram illustrating 18 medicinal compounds and 515 target components. The purple square represents the medicinal herb Paeoniae Radix Rubra, pink triangles denote the 18 chemical constituents, blue ellipses indicate the 515 target components, and black lines reflect the interactions between these nodes. (B) The volcano plot derived from the GSE15653 microarray dataset, with red dots on the right representing 991 upregulated genes, and blue dots on the left indicating 1,300 downregulated genes. (C) The volcano plot from the GSE111412 microarray dataset, where red dots on the right signify 787 upregulated genes, and blue dots on the left correspond to 467 downregulated genes. (D) The intersection between 515 component targets and 4,716 disease targets, illustrated by an Upset plot on the left and a Venn diagram on the right, with the intersecting targets constituting 4% of the total. (E) The protein-protein interaction (PPI) network of 217 intersecting targets, where three protein targets—PANK3, QTRT1, and DYRK1B—are shown as isolated, with no interactions with other protein targets. (F) Visualization of 214 targets obtained from the PPI analysis imported into Cytoscape. Each node symbolizes a target, represented by a circle, while the edges depict the interactions between targets. Targets with higher degree values are represented by larger areas and warmer colors; stronger interactions are indicated by thicker and cooler-colored edges. (G) Identification of 14 core targets selected through the CytoNCA, MCODE, and CytoHubba modules.
Fig. 2
Fig. 2
GO Enrichment and KEGG Pathway Enrichment Analysis of Core Targets for PRR in the Treatment of Hyperlipidemia. A. A chord diagram visualizing the top 10 Biological Process (BP) terms from the GO enrichment analysis, illustrating the relationships between different biological processes and core targets. B., C. Chord diagrams representing the top 10 Cellular Component (CC) and Molecular Function (MF) terms from the GO enrichment analysis, respectively, showcasing the connections between cellular components, molecular functions, and core targets. D. A bar chart summarizing the GO enrichment analysis results for the core targets in the treatment of hyperlipidemia. The chart integrates BP, CC, and MF categories, distinguished by different colors—pink for BP, dark blue for CC, and light blue for MF. The y-axis, labeled as -Log10(p), reflects the significance level of each term. E. A bubble chart representing the enrichment analysis for BP, CC, and MF categories, where the size and color of the bubbles display multidimensional data. The y-axis indicates the enriched biological processes, cellular components, and molecular functions, while the x-axis represents the Gene Ratio (the ratio of genes enriched in a given term to the total genes used in the analysis). The bubble size corresponds to the number of targets enriched in each category, and the color indicates the significance level, with pink signifying higher significance. F. A Sankey-bubble chart visualizing the pathway enrichment analysis results for hyperlipidemia treatment using Paeoniae Radix Rubra. The left side features a Sankey diagram showing the genes involved in each pathway, while the right side displays a bubble chart. The bubbles are positioned according to the Gene Ratio, sized according to the number of genes enriched in each pathway, and colored according to the p-value, with red indicating higher significance.
Fig. 3
Fig. 3
Molecular Docking Visualization of CS14, CS15 with Core Targets P53, HMGCR, and SREBP2. A., B. Display the docking interactions between CS14, CS15, and P53. C., D. Display the docking interactions of CS14, CS15 with HMGCR. E., F. Display the docking interactions between CS14, CS15, and SREBP2. G. Serves as the 2D docking diagram legend, including types of binding bonds and the solvent environment of amino acids. In the Enlarge view (2D), the 2D structure of the small molecules and their docking with amino acids are presented. Specifically, CS14 and CS15 dock with Lys101 and Ser95 of P53, Lys549 and Glu505 of HMGCR, and Try63 and Glu29 of SREBP2. In the Enlarge view (3D), the small molecule ligands are shown in green, docking amino acid residues are in blue-pink, both represented in ball-and-stick models. The macromolecular receptors are shown in pale pink, with the docking atoms of the residues and binding bonds marked in orange boxes. The protein surface electrostatic potential map is depicted in blue (high energy) and red (low energy), with binding energies indicated in the bottom right corner.
Fig. 4
Fig. 4
The Effects of PRR on Body Weight, Food Intake, Liver Index, and Fat Content in Mice Fed a High-Fat Diet. A. Shows the changes in body weight over 8 weeks of feeding in the NC (normal control) group and the HFD (high-fat diet) group. By the 8th week, the average body weight of mice in the NC group was 41.08 g, while in the HFD group, it was 50.05 g. B., C. Represent the levels of total cholesterol (TC) and triglycerides (TG) in the HFD group at the 8th week. D. Illustrates the changes in body weight across different groups during the 5-week treatment period. E. Shows the changes in food intake across all groups during the 13 weeks of feeding. F., G. Display the liver index and fat content across the groups. H. Provides imaging of fat content in mice across the different groups. Significance levels are indicated as follows: compared to the NC group, #P<0.05, ##P<0.01; compared to the HFD group, *P<0.05, **P<0.01.
Fig. 5
Fig. 5
The Effects of PRR on Biochemical Indicators and Histopathology in Mice Fed a High-Fat Diet. A-H Represent the levels of various biochemical indicators in the serum of mice across different groups: total cholesterol (TC), triglycerides (TG), high-density lipoprotein cholesterol (HDL-C), low-density lipoprotein cholesterol (LDL-C), alanine aminotransferase (ALT), aspartate aminotransferase (AST), superoxide dismutase (SOD), and malondialdehyde (MDA). I. Displays the hematoxylin and eosin (HE) staining of liver tissues across groups. J. Displays the Oil Red O staining of liver tissues across groups, indicating lipid accumulation. K. Quantifies the positive Oil Red O stained area in liver tissues. L. Displays the HE staining of perirenal adipose tissues across groups. The scale bar for images in I, J, and L is 100 μm.Significance levels are indicated as follows: compared to the NC group, #P<0.05, ##P<0.01; compared to the HFD group, *P<0.05, **P<0.01.
Fig. 6
Fig. 6
The Effects of PRR on the Gut Microbiota Composition of Mice Fed a High-Fat Diet. A-D Represent the changes in four α-diversity indices (ACE, Chao1, Shannon, Simpson) across the four groups, reflecting the diversity within each group. E. Displays the Venn diagram of OTU intersections among the four groups, showing the shared and unique OTUs. F., G. Represent the β-diversity analysis results, including Principal Coordinates Analysis (PCoA) and Non-metric Multidimensional Scaling (NMDS), which illustrate differences in microbial community composition among the groups. H. Shows the composition of gut microbiota at the phylum level across the groups. I. Indicates the changes in the Firmicutes/Bacteroidota (F/B) ratio across the groups. J. Displays the gut microbiota composition at the genus level across the groups. K. Presents the results of the LEfSe (Linear discriminant analysis Effect Size) analysis, highlighting significant differences in specific bacteria between the groups. L. Shows the changes in the phyla Firmicutes, Bacteroidota, and Proteobacteria across the groups. M. Illustrates the changes in specific genera, including Escherichia_Shigella, Allobaculum, unclassified_Muribaculaceae, Parabacteroides, Lactobacillus, Bacteroides, Alloprevotella, Bacillus, and Ligilactobacillus, across the groups. Significance levels are indicated as follows: compared to the NC group, #P<0.05, ##P<0.01; compared to the HFD group, *P<0.05, **P<0.01.
Fig. 7
Fig. 7
The Effects of PRR on the Enrichment Analysis of Gut Microbiota in Mice Fed a High-Fat Diet. A-D Show the differential abundance analysis of KEGG functional classifications, which from KEGG (https://www.kegg.jp/). A. Displays the top 10 functional categories with the most significant differences (P<0.05) between the two groups, focusing on functions with the highest relative abundance. B-D Present the top 10 functional categories with significant differences in abundance between the HFD group and the NC group, the SIM group and the HFD group, and the CSH group and the HFD group, respectively. On the left, “Mean Proportion” indicates the relative abundance of different functions in the two sample groups, while the right shows the difference in functional abundance proportions within the 95% confidence interval. E-H Illustrate the differential abundance analysis of COG functional classifications. E. Similarly filters the top 10 functional categories with the most significant differences (P<0.05) between the two groups based on relative abundance. F-H Correspond to the same comparisons as in B-D, highlighting the top 10 COG functional categories with significant differences in abundance between the groups. The left side shows “Mean Proportion”, and the right side displays the difference in functional abundance proportions within the 95% confidence interval.
Fig. 8
Fig. 8
The Effects of PRR on Mevalonate Pathway-Related Proteins in the Livers of Mice Fed a High-Fat Diet. A., B. Show the results of immunoblotting analysis for the proteins P53, HMGCR, SREBP2, ABCA1, MVD, and MVK in liver tissues of the different groups of mice. C-H Quantify the immunoblotting results for each of the above proteins across the different groups. I. Represents the ACAT enzyme levels in the liver tissues of each group. J-M Show the immunohistochemical analysis of HMGCR and SREBP2 proteins in the liver tissues. J., K. Quantify the positive staining for HMGCR and SREBP2 proteins. L., M. Display the immunohistochemical staining images, where blue indicates the cell nucleus, and brownish-yellow granules indicate positive protein staining. The scale bar represents 100 μm. Significance levels are indicated as follows: compared to the NC group, #P<0.05, ##P<0.01; compared to the HFD group, *P<0.05, **P<0.01.

Similar articles

References

    1. Worldwide trends in underweight and obesity from 1990 to 2022: a pooled analysis of 3663 population-representative studies with 222 million children, adolescents, and adults. Lancet403, 1027–1050 (2024). 10.1016/s0140-6736(23)02750-2 - PMC - PubMed
    1. Zhang, Y., Wang, Z., Jin, G., Yang, X. & Zhou, H. Regulating dyslipidemia effect of polysaccharides from pleurotus ostreatus on fat-emulsion-induced hyperlipidemia rats. Int. J. Biol. Macromol.101, 107–116. 10.1016/j.ijbiomac.2017.03.084 (2017). - PubMed
    1. Svegliati-Baroni, G. et al. Glucagon-like peptide-1 receptor activation stimulates hepatic lipid oxidation and restores hepatic signalling alteration induced by a high-fat diet in nonalcoholic steatohepatitis. Liver Int.31, 1285–1297. 10.1111/j.1478-3231.2011.02462.x (2011). - PubMed
    1. Jia, X. et al. Impact of gut microbiota and microbiota-Related metabolites on hyperlipidemia. Front. Cell. Infect. Microbiol.11, 634780. 10.3389/fcimb.2021.634780 (2021). - PMC - PubMed
    1. Tan, Y. Q., Chen, H. W., Li, J., Wu, Q. J. & Efficacy Chemical constituents, and Pharmacological actions of Radix paeoniae rubra and Radix paeoniae Alba. Front. Pharmacol.11, 1054. 10.3389/fphar.2020.01054 (2020). - PMC - PubMed

MeSH terms