

Muscle-Driven prognostication in gastric cancer: A multicenter deep learning framework integrating Iliopsoas and erector spinae radiomics for 5-Year survival prediction
- PMID: 40596621
- PMCID: PMC12215766
- DOI: 10.1038/s41598-025-09083-y
Muscle-Driven prognostication in gastric cancer: A multicenter deep learning framework integrating Iliopsoas and erector spinae radiomics for 5-Year survival prediction
Abstract
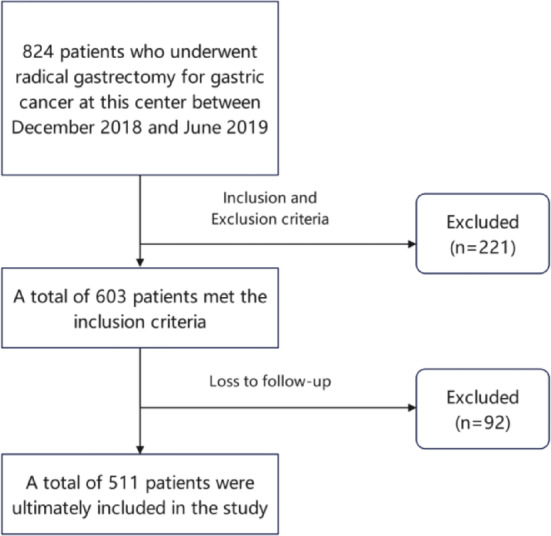
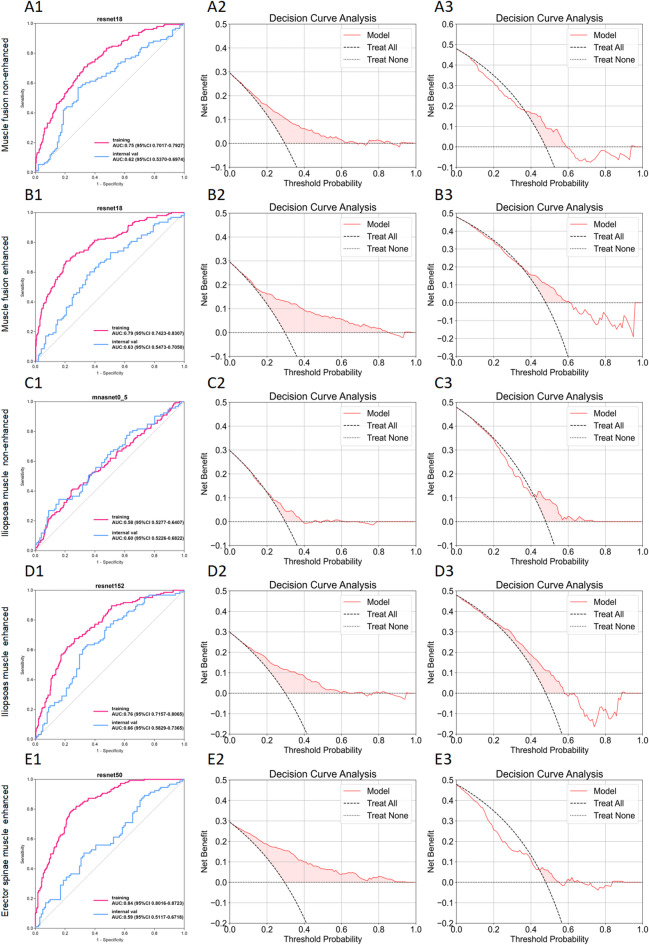
This study developed a 5-year survival prediction model for gastric cancer patients by combining radiomics and deep learning, focusing on CT-based 2D and 3D features of the iliopsoas and erector spinae muscles. Retrospective data from 705 patients across two centers were analyzed, with clinical variables assessed via Cox regression and radiomic features extracted using deep learning. The 2D model outperformed the 3D approach, leading to feature fusion across five dimensions, optimized via logistic regression. Results showed no significant association between clinical baseline characteristics and survival, but the 2D model demonstrated strong prognostic performance (AUC ~ 0.8), with attention heatmaps emphasizing spinal muscle regions. The 3D model underperformed due to irrelevant data. The final integrated model achieved stable predictive accuracy, confirming the link between muscle mass and survival. This approach advances precision medicine by enabling personalized prognosis and exploring 3D imaging feasibility, offering insights for gastric cancer research.
Keywords: Deep learning; Gastric cancer; Radical gastrectomy; Sarcopenia.
© 2025. The Author(s).
Conflict of interest statement
Declarations. Competing interests: The authors declare no potential conflict of interest in the research, writing, and publication of this article. Financial support: This study was supported by a grant from the Graduate Student Research and Practice Innovation Program of Anhui Medical University (YJS20230080), National Natural Science Foundation of China (82403333).
Figures


Similar articles
-
Psoas muscle CT radiomics-based machine learning models to predict response to infliximab in patients with Crohn's disease.Ann Med. 2025 Dec;57(1):2527954. doi: 10.1080/07853890.2025.2527954. Epub 2025 Jul 5. Ann Med. 2025. PMID: 40616584 Free PMC article.
-
Transformer-based skeletal muscle deep-learning model for survival prediction in gastric cancer patients after curative resection.Gastric Cancer. 2025 Jul;28(4):684-695. doi: 10.1007/s10120-025-01614-w. Epub 2025 Apr 15. Gastric Cancer. 2025. PMID: 40232557 Free PMC article.
-
2.5D deep learning radiomics and clinical data for predicting occult lymph node metastasis in lung adenocarcinoma.BMC Med Imaging. 2025 Jul 1;25(1):225. doi: 10.1186/s12880-025-01759-1. BMC Med Imaging. 2025. PMID: 40597741 Free PMC article.
-
MRI-Based Radiomics Methods for Predicting Ki-67 Expression in Breast Cancer: A Systematic Review and Meta-analysis.Acad Radiol. 2024 Mar;31(3):763-787. doi: 10.1016/j.acra.2023.10.010. Epub 2023 Nov 2. Acad Radiol. 2024. PMID: 37925343
-
Cost-effectiveness of using prognostic information to select women with breast cancer for adjuvant systemic therapy.Health Technol Assess. 2006 Sep;10(34):iii-iv, ix-xi, 1-204. doi: 10.3310/hta10340. Health Technol Assess. 2006. PMID: 16959170
References
-
- Fukuda, Y. et al. Sarcopenia is associated with severe postoperative complications in elderly gastric cancer patients undergoing gastrectomy. Gastric Cancer. 19 (3), 986–993. 10.1007/s10120-015-0546-4 (2016). - PubMed
-
- Ricciardolo, A. A. et al. Strong impact of sarcopenia as a risk factor of survival in resected gastric cancer patients: first Italian report of a bicentric study. Updates Surg.74 (1), 283–293. 10.1007/s13304-021-01175-4 (2022). - PubMed
-
- Yang, W. et al. Quantifying skeletal muscle wasting during chemoradiotherapy with Jacobian calculations for the prediction of survival and toxicity in patients with gastric cancer. Eur. J. Surg. Oncol.46 (7), 1254–1261. 10.1016/j.ejso.2020.03.223 (2020). - PubMed
Publication types
MeSH terms
Grants and funding
LinkOut - more resources
Full Text Sources
Medical
