. 2025 Jul 1;15(1):20760.
doi: 10.1038/s41598-025-07827-4.

Quantitative ultrasound classification of healthy and chemically degraded ex-vivo cartilage

Affiliations

Quantitative ultrasound classification of healthy and chemically degraded ex-vivo cartilage

Angela Sorriento et al. Sci Rep. .

Abstract

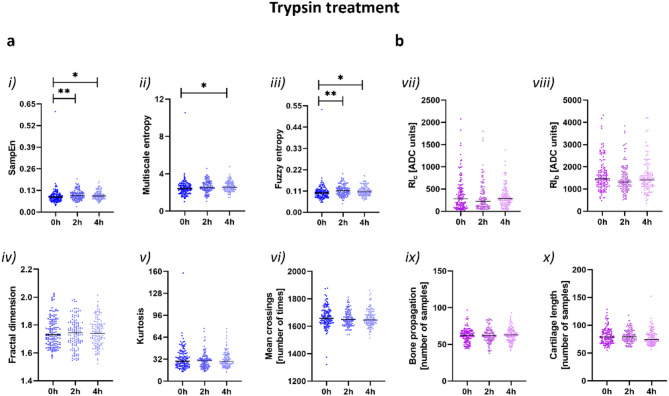
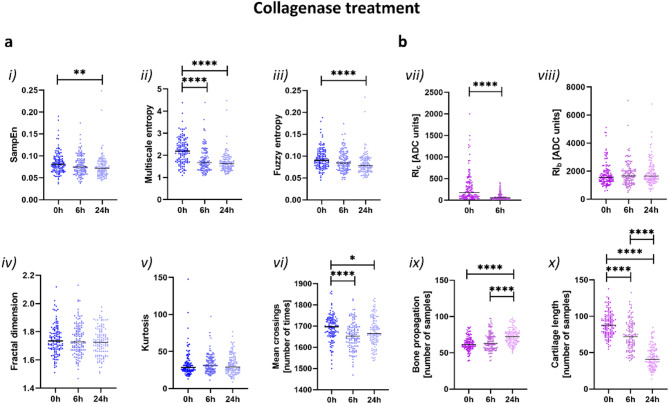
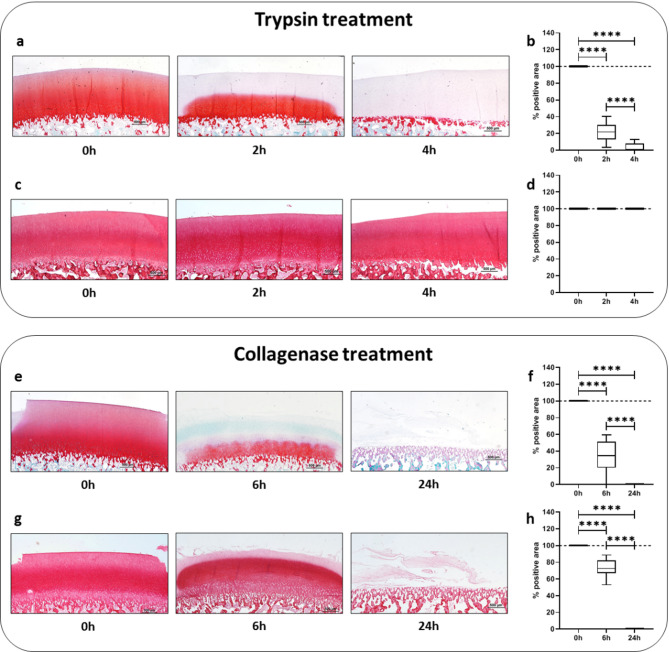
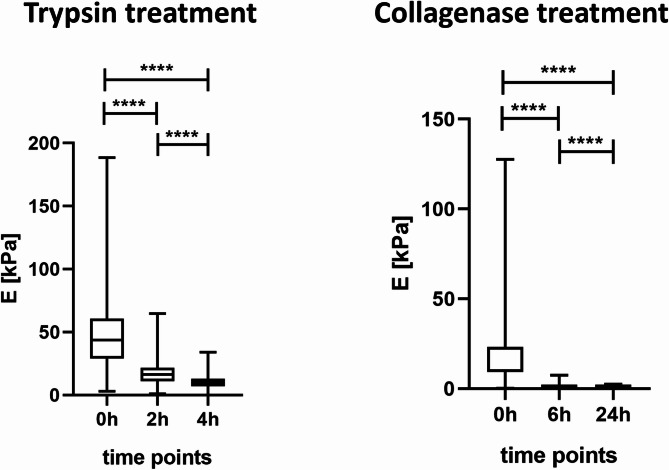
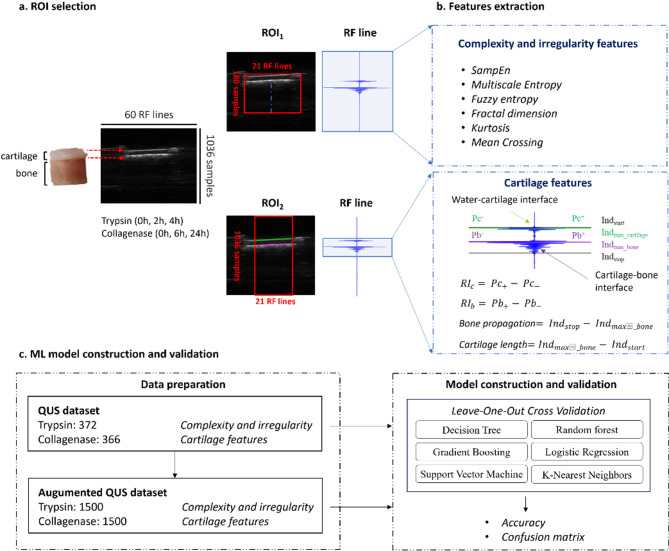
In this study, we explore the potential of ten quantitative (radiofrequency-based) ultrasound parameters to assess the progressive loss of collagen and proteoglycans, mimicking an osteoarthritis condition in ex-vivo bovine cartilage samples. Most analyzed metrics showed significant changes as the degradation progressed, especially with collagenase treatment. We propose for the first time a combination of these ultrasound parameters through machine learning models aimed at automatically identifying healthy and degraded cartilage samples. The random forest model showed good performance in distinguishing healthy cartilage from trypsin-treated samples, with an accuracy of 60%. The support vector machine demonstrated excellent accuracy (96%) in differentiating healthy cartilage from collagenase-degraded samples. Histological and mechanical analyses further confirmed these findings, with collagenase having a more pronounced impact on both mechanical and histological properties, compared to trypsin. These metrics were obtained using an ultrasound probe having a transmission frequency of 15 MHz, typically used for the diagnosis of musculoskeletal diseases, enabling a fully non-invasive procedure without requiring arthroscopic probes. As a perspective, the proposed quantitative ultrasound assessment has the potential to become a new standard for monitoring cartilage health, enabling the early detection of cartilage pathologies and timely interventions.


Conflict of interest statement

Declarations. Competing interests: The authors declare no competing interests.

Figures

Fig. 1
Fig. 1
QUS metrics of cartilage samples treated using trypsin. Complexity and irregularity parameters are reported in (a) i) sampEn, ii) multiscale entropy, iii) fuzzy entropy, iv) fractal dimension, v) kurtosis, vi) mean crossing. Multiscale entropy was derived by computing sample entropy across 10 scales, with the area under the resulting curve serving as its measure. Cartilage features are reported in (b) vii) RIc, viii) RIb, ix) bone propagation, x) cartilage length. Group-wise differences were analyzed using the non-parametric Kruskal-Wallis test, with Dunn’s test as a post-hoc analysis for multiple comparisons. *p < 0.0332, **p < 0.0021, ***p < 0.0002, ****p < 0.0001. N consisted of 128 independent tissue samples at 0 h, 124 at 2 h and 120 at 4 h, with 21 RF lines analyzed per sample.
Fig. 2
Fig. 2
QUS metrics of cartilage samples treated using collagenase. Complexity and irregularity parameters are reported in (a): (i) sampEn, (ii) multiscale entropy, (iii) fuzzy entropy, (iv) fractal dimension, (v) kurtosis, (vi) mean crossing. Multiscale entropy was derived by computing sample entropy across 10 scales, with the area under the resulting curve serving as its measure. Cartilage features are reported in (b): (vii) RIc, (viii) RIb, (ix) bone propagation, (x) cartilage length. Group-wise differences were analyzed using the non-parametric Kruskal-Wallis test, with Dunn’s test as a post-hoc analysis for multiple comparisons. *p < 0.0332, **p < 0.0021, ***p < 0.0002, ****p < 0.0001. N consisted of 126 independent tissue samples at 0 h, 122 at 6 h and 118 at 24 h, with 21 RF lines analyzed per sample.
Fig. 3
Fig. 3
Confusion matrices of the classifiers with the highest accuracy achieved for trypsin and collagenase treatment: (a) random forest and SVM to distinguish 2 levels of degradation; (b) random forest and SVM to distinguish 3 levels of degradation; (c) random forest to distinguish 3 levels of degradation, where a SMOTE technique was applied for generating synthetic samples, creating a dataset with 500 samples per class.
Fig. 4
Fig. 4
Representative histological images of Safranin O (a) and Picrosirius (c) Red-positive stained area of the cartilage treated with trypsin at three different time points (0 h, 2 h and 4 h) with the corresponding quantification of cartilage positive area (b,d, respectively), and representative histological images of Safranin O (e) and Picrosirius (g) Red-positive stained area of the cartilage treated with collagenase at three different time points (0 h, 6 h and 24 h), with the corresponding quantification of cartilage positive area (f,h, respectively). Quantification of cartilage positive area (b,d,f,h) is represented as Box-plot with median, minimum and maximum. Group-wise differences were analyzed using the non-parametric Kruskal-Wallis test, with Dunn’s test as a post-hoc analysis for multiple comparisons: ****p < 0.0001. N = 4 independent tissue samples per group.
Fig. 5
Fig. 5
Young’s modulus of elasticity of samples treated with trypsin and collagenase, obtained through AFM indentation. Group-wise differences were analyzed using the non-parametric Kruskal-Wallis test, with Dunn’s test as a post-hoc analysis for multiple comparisons: ****p < 0.0001. N consisted of 19 independent tissue samples per group for trypsin and 20 independent tissue samples per group for collagenase.
Fig. 6
Fig. 6
Workflow for RF data analysis. In (a), a representative B-mode image is shown, highlighting the cartilage and bone interfaces. Two regions of interest were identified for feature extraction: ROI1, which includes the central portion of the B-mode image and ROI2, in the middle of the sample to avoid irregular boundaries. Complexity and irregularity features were calculated in ROI1, while cartilage features were computed in ROI2 (b). In (c), the workflow for ML model construction is represented. For each dataset (complexity and irregularity and cartilage features), a feature selection step has been applied to extract the most informative features to build the ML models.

Similar articles

References

    1. Sophia Fox, A. J., Bedi, A. & Rodeo, S. A. The basic science of articular cartilage: structure, composition, and function. Sports Health. 1(6), 461–468. 10.1177/1941738109350438 (2009). - PMC - PubMed
    1. Daou, F., Cochis, A., Leigheb, M. & Rimondini, L. Current advances in the regeneration of degenerated articular cartilage: A literature review on tissue engineering and its recent clinical translation. Materials15(1), 31. 10.3390/ma15010031 (2021). - PMC - PubMed
    1. L’Hermette, M., Tourny-Chollet, C., Polle, G. & Dujardin, F. Articular cartilage, degenerative process, and repair: current progress. Int. J. Sports Med.27(9), 738–744. 10.1055/s-2005-872824 (2006). - PubMed
    1. Daher, R. J., Chahine, N. O., Greenberg, A. S., Sgaglione, N. A. & Grande, D. A. New methods to diagnose and treat cartilage degeneration. Nat. Rev. Rheumatol.5(11), 599–607. 10.1038/nrrheum.2009.204 (2009). - PubMed
    1. D’Agostino, V. et al. Ultrasound imaging in knee osteoarthritis: current role, recent advancements, and future perspectives. J. Clin. Med.13(16), 4930. 10.3390/jcm13164930 (2024). - PMC - PubMed