

Identification of mitophagy-related genes with diagnostic value in acute rejection following kidney transplantation using bioinformatics analysis
- PMID: 40596704
- PMCID: PMC12214719
- DOI: 10.1038/s41598-025-09143-3
Identification of mitophagy-related genes with diagnostic value in acute rejection following kidney transplantation using bioinformatics analysis
Abstract
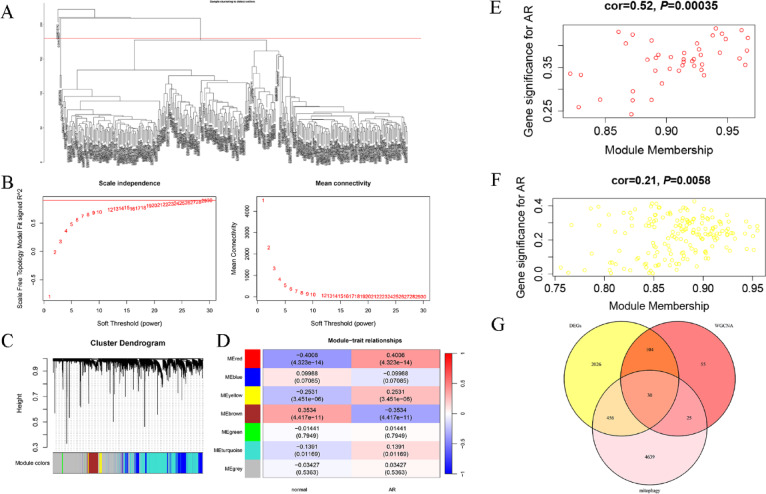
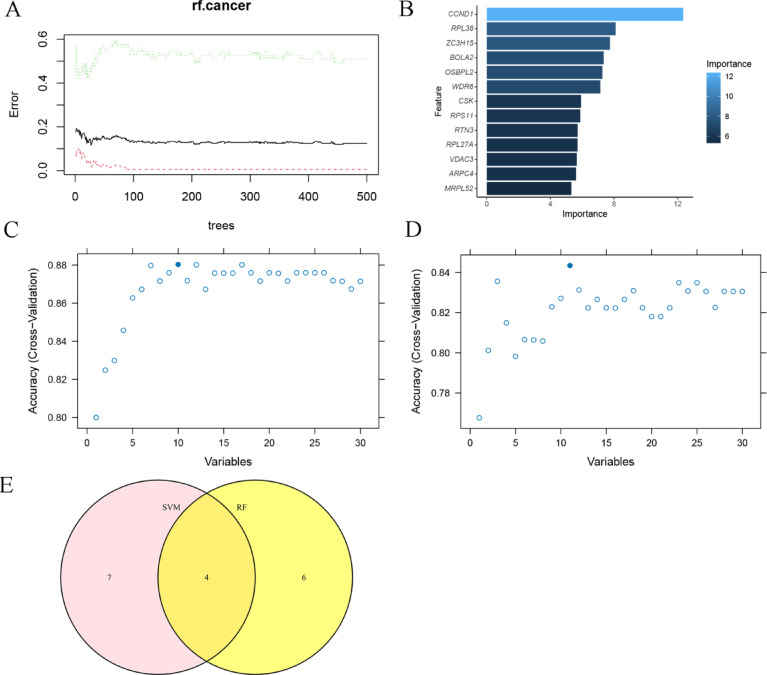
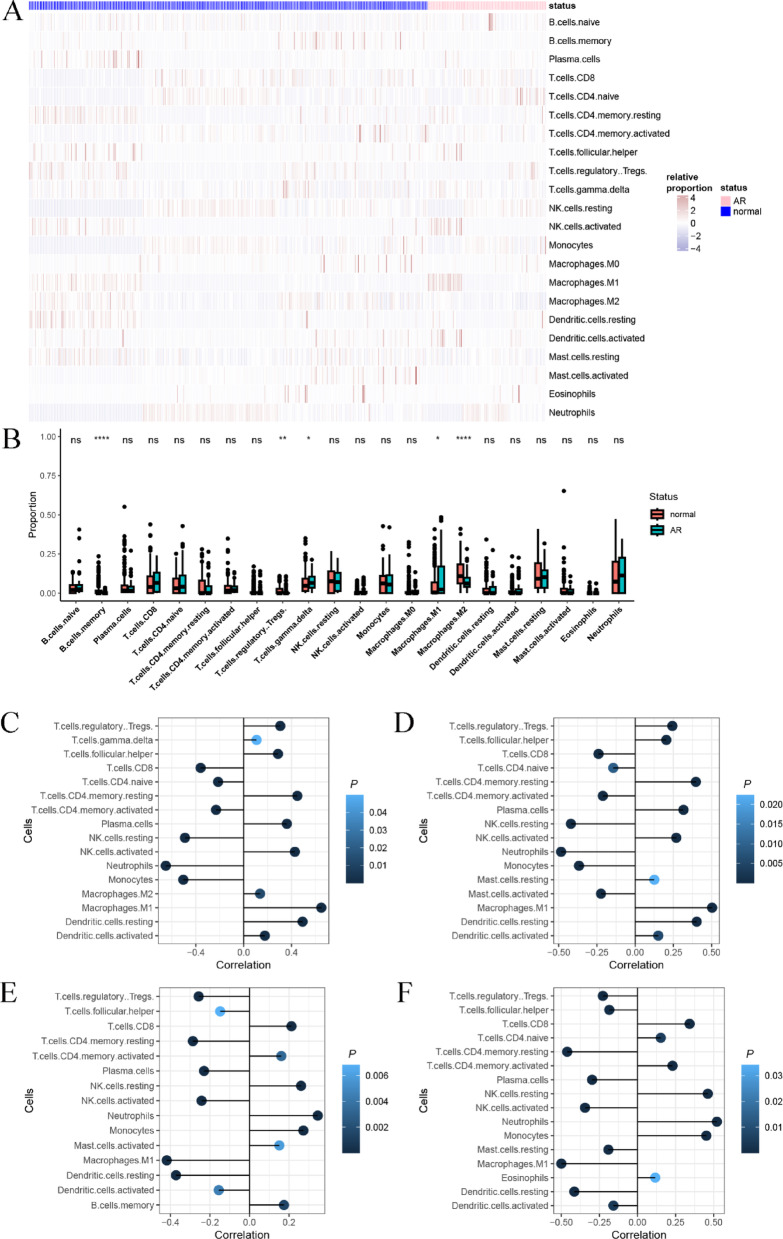
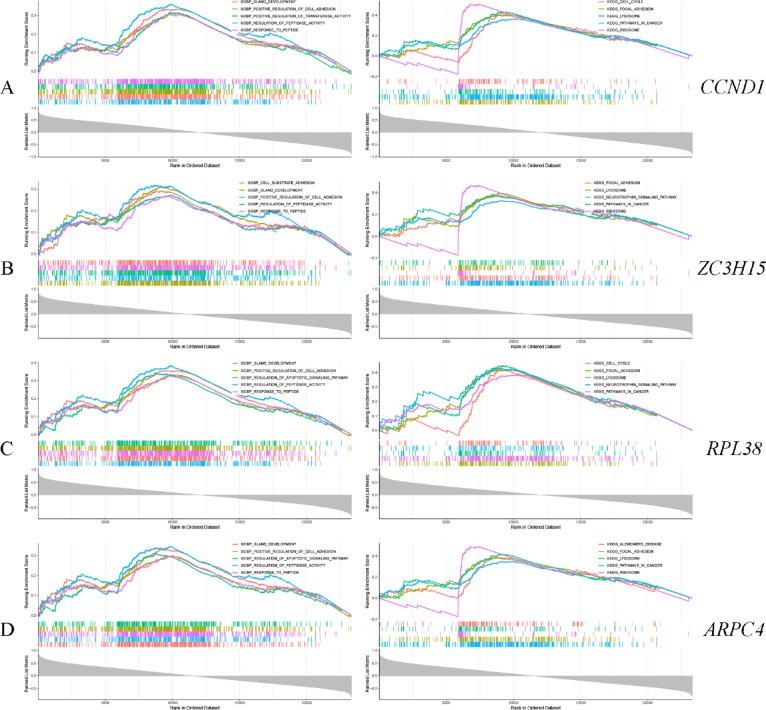
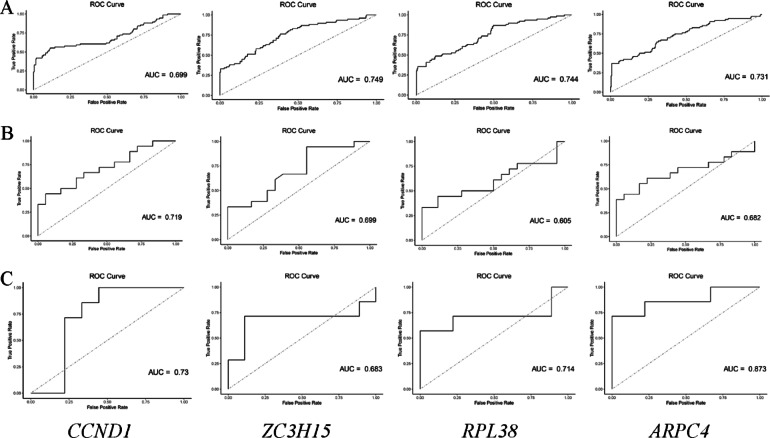
Acute rejection (AR) after kidney transplantation, is a common and serious complication that occurs when the recipient's immune system attacks the graft, and the specific genes and molecular mechanisms underlying the role of mitophagy are still unclear. This study integrated two transcriptomic datasets (GSE129166 and GSE25902) from the GEO database. Thirty differential mitophagy-related genes were identified by intersecting differentially expressed genes, module genes obtained through weighted gene co-expression network analysis and mitophagy-related genes. Functional enrichment analysis uncovered several biological processes and signaling pathways associated with these genes. Four candidate genes including CCND1, ZC3H15, RPL38, and ARPC4, were further identified through Random Forest and Support Vector Machine with recursive feature elimination. Internal, external datasets and a nomogram confirmed they could effectively predict AR. Moreover, these genes significantly correlated with the infiltration of multiple immune cells. Differential expressions of the four genes were also validated in patient's peripheral blood and AR mice. These four mitophagy-related genes may be novel biomarkers for predicting the occurrence and diagnosis of AR.
Keywords: Acute rejection; Gene signature; Immune cells; Kidney transplantation; Mitophagy.
© 2025. The Author(s).
Conflict of interest statement
Declarations. Competing interests: The authors declare no competing interests.
Figures


Similar articles
-
Deciphering Shared Gene Signatures and Immune Infiltration Characteristics Between Gestational Diabetes Mellitus and Preeclampsia by Integrated Bioinformatics Analysis and Machine Learning.Reprod Sci. 2025 Jun;32(6):1886-1904. doi: 10.1007/s43032-025-01847-1. Epub 2025 May 15. Reprod Sci. 2025. PMID: 40374866
-
Identification of mitophagy-related biomarkers with immune cell infiltration in psoriasis.BMC Med Genomics. 2025 Jul 1;18(1):110. doi: 10.1186/s12920-025-02176-7. BMC Med Genomics. 2025. PMID: 40598168 Free PMC article.
-
Bioinformatics identification and validation of m6A/m1A/m5C/m7G/ac4 C-modified genes in oral squamous cell carcinoma.BMC Cancer. 2025 Jul 1;25(1):1055. doi: 10.1186/s12885-025-14216-7. BMC Cancer. 2025. PMID: 40597017 Free PMC article.
-
Polyclonal and monoclonal antibodies for treating acute rejection episodes in kidney transplant recipients.Cochrane Database Syst Rev. 2017 Jul 20;7(7):CD004756. doi: 10.1002/14651858.CD004756.pub4. Cochrane Database Syst Rev. 2017. PMID: 28731207 Free PMC article.
-
How lived experiences of illness trajectories, burdens of treatment, and social inequalities shape service user and caregiver participation in health and social care: a theory-informed qualitative evidence synthesis.Health Soc Care Deliv Res. 2025 Jun;13(24):1-120. doi: 10.3310/HGTQ8159. Health Soc Care Deliv Res. 2025. PMID: 40548558
References
-
- Rodrigo, E., Chedid, M. F., San Segundo, D., San Millán, J. C. R. & López-Hoyos, M. Acute rejection following kidney transplantation: State-of-the-Art and future perspectives. Curr. Pharm. Des.26, 3468–3496. 10.2174/1381612826666200610184433 (2020). - PubMed
-
- Ploumi, C., Daskalaki, I. & Tavernarakis, N. Mitochondrial biogenesis and clearance: a balancing act. Febs J.284, 183–195. 10.1111/febs.13820 (2017). - PubMed
MeSH terms
Grants and funding
LinkOut - more resources
Full Text Sources
Medical
Research Materials
