

Counting the costs of injury and disease to first responders as a result of extreme bushfires
- PMID: 40596722
- PMCID: PMC12215750
- DOI: 10.1038/s41598-025-08886-3
Counting the costs of injury and disease to first responders as a result of extreme bushfires
Abstract
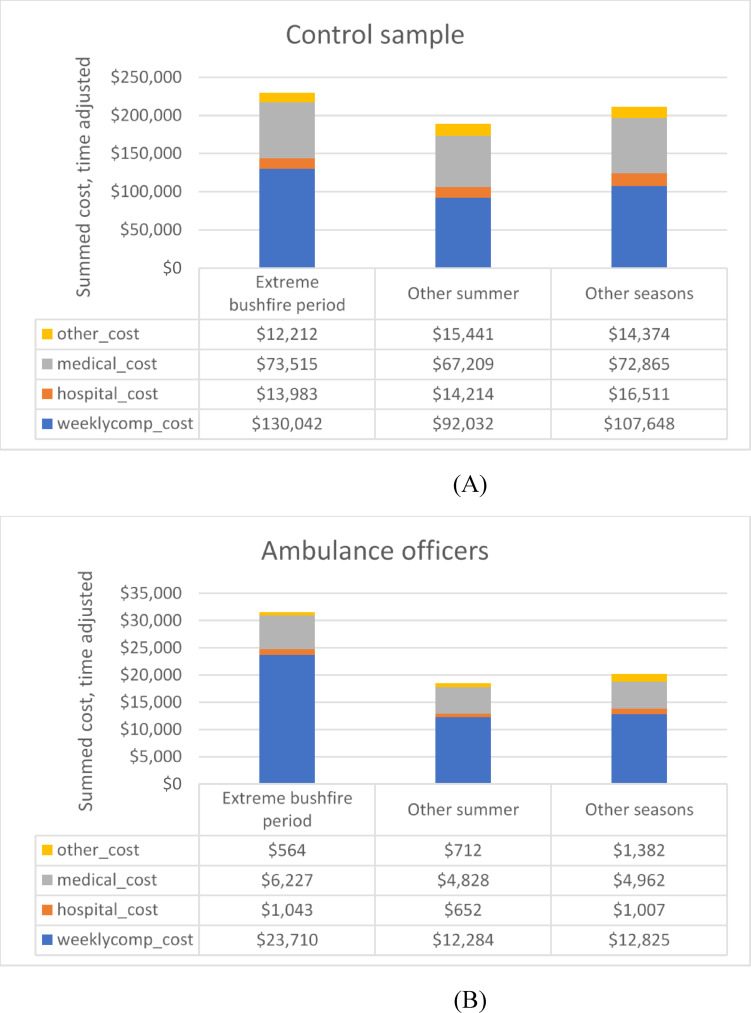
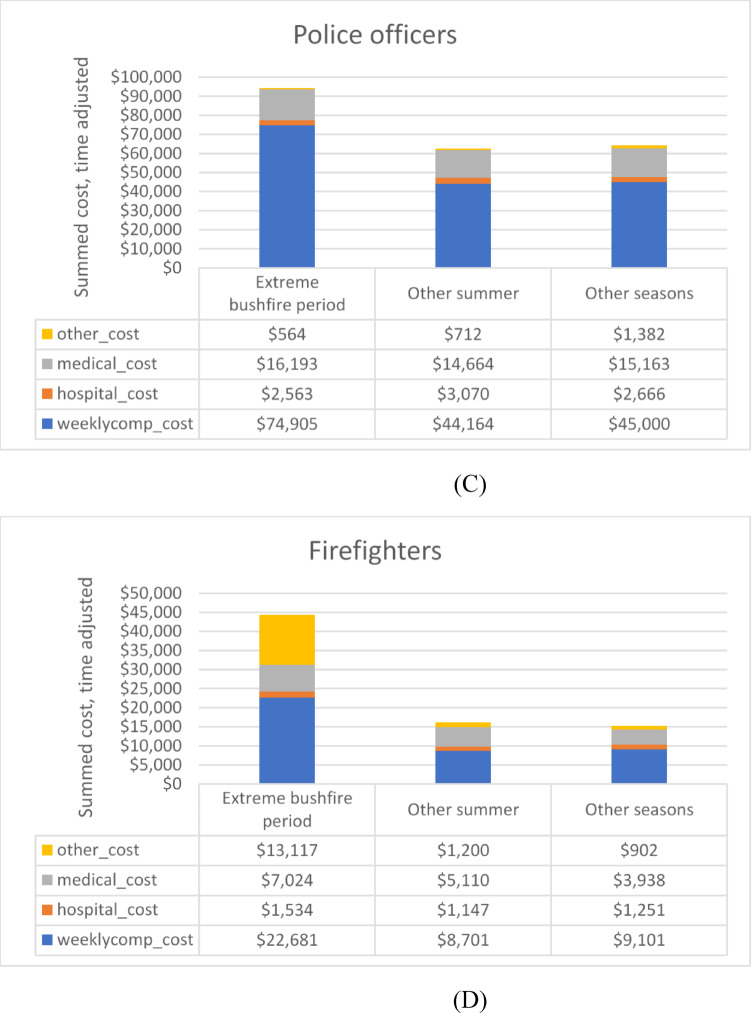
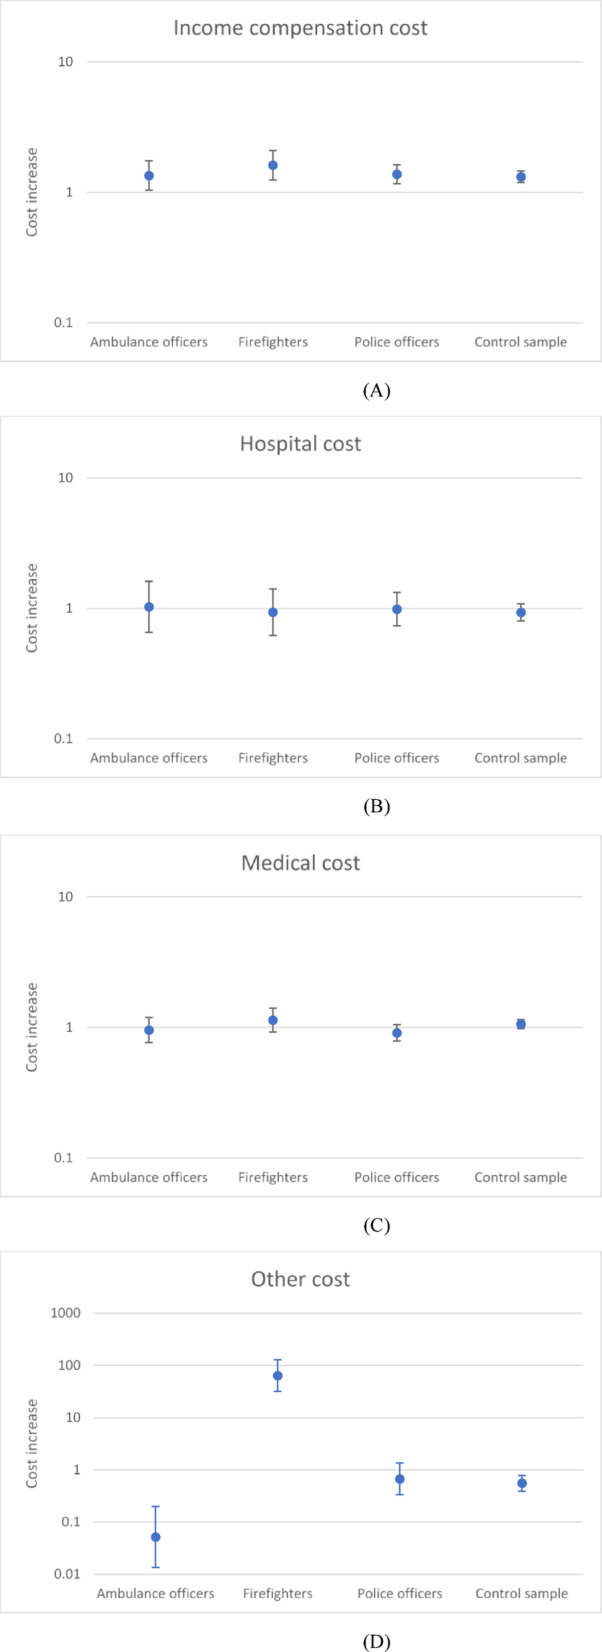
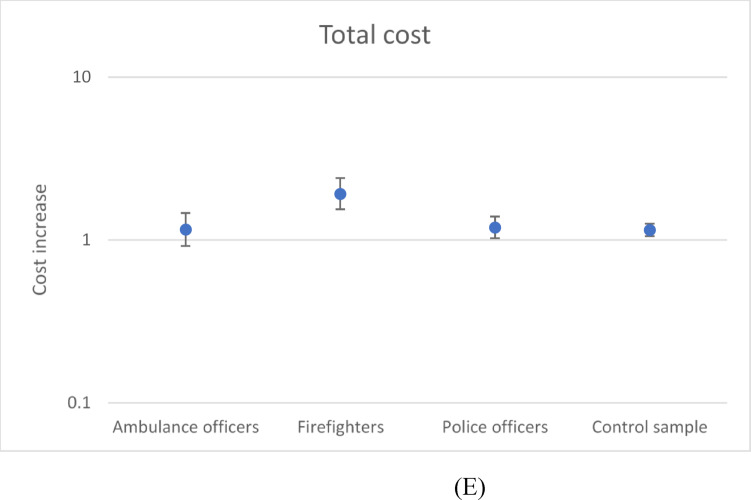
Extreme bushfires are devastating and costly and are predicted to increase in frequency. This project investigated emergency responders' (ER) compensable injury/disease costs associated with extreme bushfire periods compared with the general workforce. Workers' compensation claims data for Victoria, Australia, were sourced for ER and controls (10% of the general workforce) from January 2005 to April 2021 (encompassing two extreme bushfires). Using generalised linear models, claims from ambulance officers, career firefighters, police, and controls were compared across extreme bushfires, other summers, and all other periods. In total, ER made 749/24,008 (3.1%) claims in extreme bushfire periods, compared to 1254/49,484 (2.5%) in the controls. The study group overall (including both ER and the general workforce control group) experienced significantly higher income compensation costs/claims during extreme bushfire periods, with a 31% increase. ER' costs/claims were highest for mental illness, burns and cancer. After accounting for bushfire impacts on the general workforce, total claims costs were increased by 67% among firefighters in extreme bushfire periods, largely attributable to fatality payments (other non-medical expenses). These results highlight the need for targeted injury prevention for fatal and non-fatal injuries among ERs and measures that address the broader socio-economic impacts on ERs and the general workforce.
Keywords: Bushfire; Costs; Emergency responders; Injury/Disease; Workers compensation.
© 2025. The Author(s).
Conflict of interest statement
Declarations. Competing interests: The authors declare no competing interests. Ethics approval and consent to participate: The research was performed in accordance with the Declaration of Helsinki. This study was approved by the Monash University Human Research Ethics Committee, Project ID 39153. The need for informed individual consent was waived by the Monash University Human Research Ethics Committee; only de-identified data were used, and results were reported in a non-re-identifiable format. Consent for publication: N/A.
Figures
Similar articles
-
Impact of Extreme Bushfires on Occupational Injury and Disease Claims in the Nonemergency Response Labor Force.Am J Ind Med. 2025 Sep;68(9):796-805. doi: 10.1002/ajim.70004. Epub 2025 Jul 9. Am J Ind Med. 2025. PMID: 40629939
-
Impact of extreme bushfire seasons on rates of occupational injury and disease compensation claims in first responders.Int Arch Occup Environ Health. 2024 Dec;97(10):1037-1049. doi: 10.1007/s00420-024-02103-w. Epub 2024 Nov 6. Int Arch Occup Environ Health. 2024. PMID: 39503908
-
First responders' occupational injury and disease associated with periods of extreme bushfires.Sci Rep. 2024 Oct 7;14(1):23305. doi: 10.1038/s41598-024-73886-8. Sci Rep. 2024. PMID: 39375491 Free PMC article.
-
Non-respiratory health risks and mortality associated with fighting bushfires (wildfires): a systematic review.Int Arch Occup Environ Health. 2025 Jul;98(4-5):343-367. doi: 10.1007/s00420-025-02138-7. Epub 2025 Apr 9. Int Arch Occup Environ Health. 2025. PMID: 40205082 Free PMC article.
-
The long-term impact of bushfires on the mental health of Australians: a systematic review and meta-analysis.Eur J Psychotraumatol. 2022 Jun 28;13(1):2087980. doi: 10.1080/20008198.2022.2087980. eCollection 2022. Eur J Psychotraumatol. 2022. PMID: 35957633 Free PMC article.
References
-
- Australian Institute for Disaster Resilience. Bushfires - Black Saturday: Australian Government - National Emergency Management Agency. [15 February 2024]. (2014). Available from: https://knowledge.aidr.org.au/resources/bushfire-black-saturday-victoria...
-
- Australian Institute for Disaster Resilience. Bushfires - Black Summer: Australian Government - National Emergency Management Agency 2020 [Available from: https://knowledge.aidr.org.au/resources/black-summer-bushfires-vic-2019-20/
-
- Wah, W. et al. Systematic review of impacts of occupational exposure to wildfire smoke on respiratory function, symptoms, measures and diseases. Int. J. Hyg. Environ Health. 263, 114463 (2025). - PubMed
-
- Gelaw, A. et al. Non-respiratory health risks and mortality associated with fighting bushfires (wildfires): a systematic review. Int. Arch. Occup. Environ. Health 1-25. (2025). - PubMed
MeSH terms
Grants and funding
LinkOut - more resources
Full Text Sources
Medical
Miscellaneous
