. 2025 Jul 1;26(1):594.
doi: 10.1186/s12864-025-11776-7.

Core histone families of mollusca: systematic identification, evolutionary insights, and functional analysis

Affiliations

Core histone families of mollusca: systematic identification, evolutionary insights, and functional analysis

Yalin Guan et al. BMC Genomics. .

Abstract

Background: Histones are the basic packaging units of eukaryotic DNA and are essential for the dynamics of chromatin and the regulation of epigenetics. Canonical histones and their variants exhibit important functional differences in biological processes. However, little is known about the role of histone family members in molluscs, which are known for their ecological and morphological diversity.

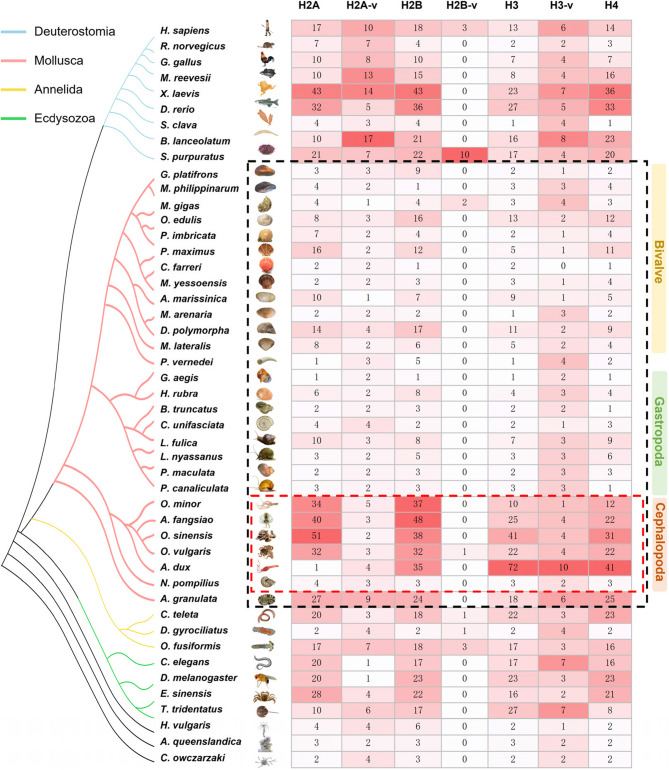
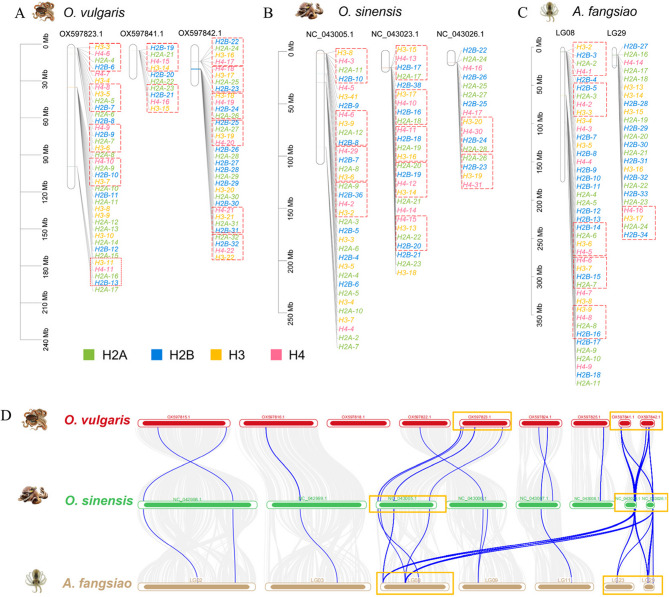
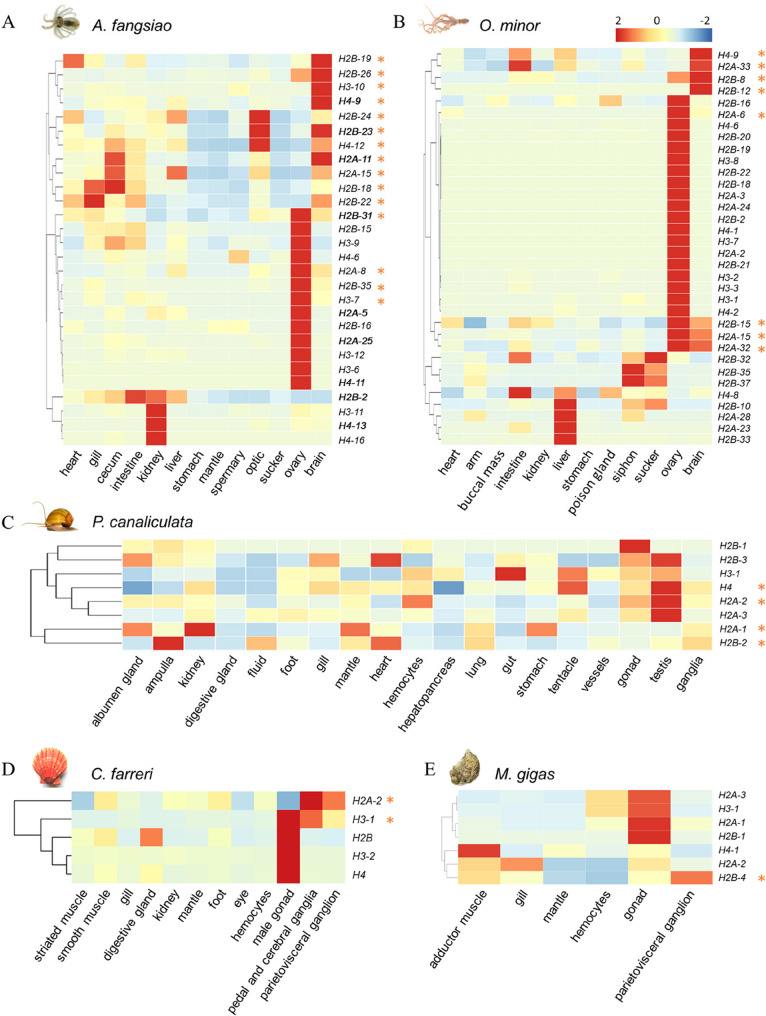
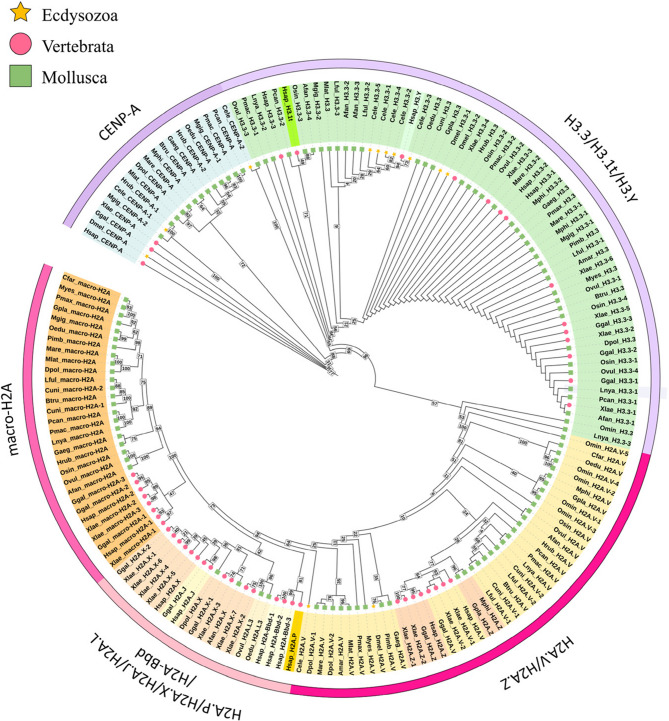
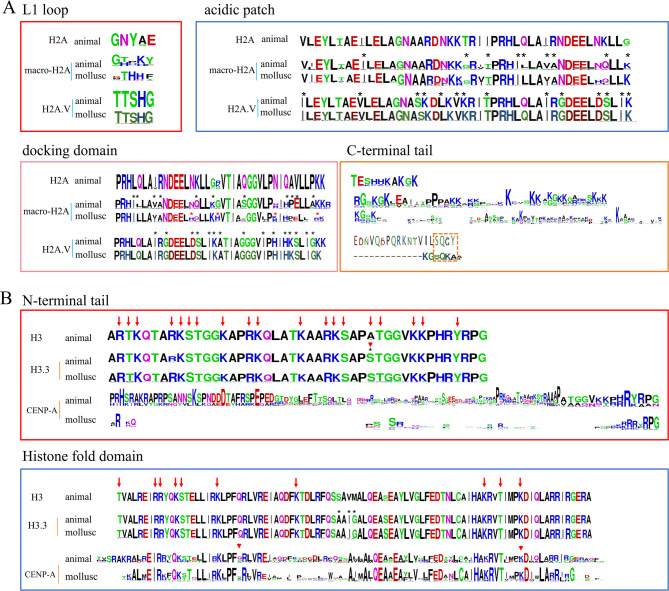
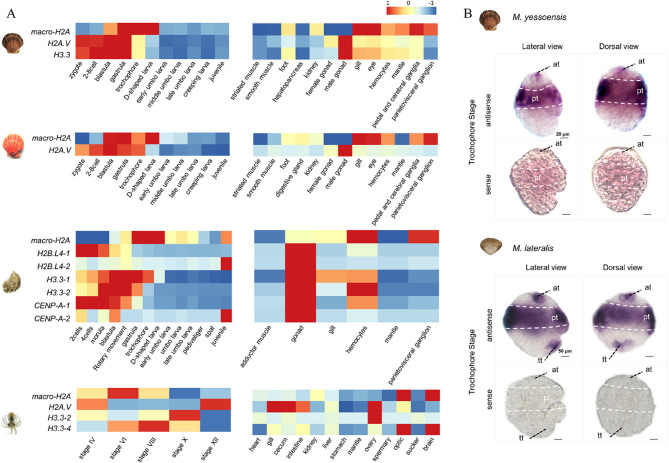
Results: Core histone families of 28 molluscan species (12 bivalves, 8 gastropods, 6 cephalopods, 1 scaphopod and 1 polyplacophora) were systematically identified. The evolutionary conservation and lineage-specific innovations were discovered using phylogenomic and transcriptomic analyses. Cephalopods showed a striking expansion of canonical histone genes with brain-enriched expression patterns. Synteny analyses revealed conserved, collinear histone clusters unique to cephalopods. Histone variants, specially H2A and H3 paralogs, display conserved motifs potentially involved in nucleosome stability and lineage-specific residues involved in functional specialization. Developmental transcriptomics revealed the dynamic expression of histone variants in early embryogenesis and the gonads, suggesting that H2A and H3 variants are involved in chromatin remodeling, pluripotency maintenance and germline regulation. Macro-H2A was highly expressed during larval neurodevelopment and in sensory organs, suggesting important roles in neural plasticity.

Conclusion: This study represents the first comprehensive inventory and characterization of core histone genes in molluscs, and will facilitate understanding of the evolutionary patterns and functional properties of core histones in relation to neurogenesis of molluscs. These findings advance our understanding of chromatin evolution and its contribution to phenotypic innovation in non-model taxa.

Keywords: Core histone families; Expression; Mollusca; Nervous system; Systematic characterization.


Conflict of interest statement

Declarations. Ethics approval and consent to participate: All our experiments have complied with relevant institutional, national, and international guidelines and legislation. Consent for publication: Not applicable. Competing interests: The authors declare no competing interests.

Figures

Fig. 1
Fig. 1
Genomic landscape of core histone gene families. Genome-wide identification of core histone families of 28 molluscs (denoted by the black dashed line) and an additional 19 diverse eukaryotic species. The phylogenetic branches are color-coded to represent different taxonomic groups: blue for Deuterostomia, pink for Mollusca, yellow for Annelida, and green for Ecdysozoa. The suffix ‘-v’ indicates histone variants
Fig. 2
Fig. 2
Chromosomal organization and macro-synteny of canonical histone clusters across octopus. A-C Chromosome maps for canonical histone genes in O. vulgaris, O. sinensis, and A. fangsiao. The dashed boxes indicated the core histone unit cluster. D Macro-synteny analysis of cephalopod histone clusters. Orange boxes indicate the histone-enriched chromosomes
Fig. 3
Fig. 3
Tissue-specific expression patterns of canonical histone genes across five mollusc species: (A) A. fangsiao, (B) O. minor, (C) P. canaliculata, (D) C. farreri, and (E) M. gigas. Bold-labeled histone IDs in panel A indicate genes located in chromosomal regions with conserved collinearity in Fig. 2D. Gene expression levels are shown as Z-scores of TPM values. The histones with higher expression levels in brain/ganglia than the average of other tissues were marked (*). The color varies from blue to red, representing the scale of the relative expression level. Genes were hierarchically clustered using Euclidean distance
Fig. 4
Fig. 4
Phylogenetic tree of histone variants in mollusca, vertebrata and Ecdysozoa. The phylogenetic tree was reconstructed using Maximum Likelihood implemented in IQ-TREE. Numbers at internal nodes indicate bootstrap support values derived from 1,000 replicates. Different colors represent different groups and different geometric shapes represent different species
Fig. 5
Fig. 5
Comparative structural mapping of histone H2A and H3 variants through metazoan evolution. A Sequence alignment of H2A domains identifies conserved functional determinants: L1 loop (red), acidic patch (blue), docking domain (pink), and C-terminal tail (orange). Divergent residues distinguishing variants from canonical H2A are marked by black asterisks; red asterisks highlight molluscan-specific substitutions in macro-H2A predicted to disrupt DNA-protein interactions. B H3 alignment reveals N-terminal tail (red) and histone fold domain (blue) across lineages. Black asterisks denote H3.3-specific divergence from canonical H3, while red arrows and arrow heads respectively denote the PTMs of canonical H3 and variants. The logos of animal were derived from published papers [5, 10], with no mollusc histone sequences incorporated
Fig. 6
Fig. 6
Expression dynamics of molluscan histone variants across ontogeny and tissues. A Heatmap visualization of transcriptional dynamics for 16 histone variants across four molluscan species (M. yessoensis, C. farreri, M. gigas, A. fangsiao). Staged transcriptomes (left panels) cover 5–14 major embryonic/larval stages, and adult histone expression (right panels) is shown across 6–13 tissues. Gene expression levels are shown as Z-scores of TPM values. The color varies from blue to red, representing the scale of the relative expression level. The developmental stages of A. fangsiao correspond to the description of Jiang et al. [85]. B Spatial restriction of macro-H2A in M. yessoensis and M. lateralis trochophore larvae by DIG-labeled antisense probe WISH. Macro-H2A expression predominates in prototroch ciliated bands (pt), telotroch (tt) and apical tuft (at), corroborating stage-specific RNA-seq profiles

Similar articles

References

    1. Luger K, Mäder AW, Richmond RK, Sargent DF, Richmond TJ. Crystal structure of the nucleosome core particle at 2.8 A resolution. Nature. 1997;389(6648):251–60. - PubMed
    1. Millán-Zambrano G, Burton A, Bannister AJ, Schneider R. Histone post-translational modifications - cause and consequence of genome function. Nat Rev Genet. 2022;23(9):563–80. - PubMed
    1. Hu Y, Yuan S, Du X, Liu J, Zhou W, Wei F. Comparative analysis reveals epigenomic evolution related to species traits and genomic imprinting in mammals. Innov (Camb). 2023;4(3):100434. - PMC - PubMed
    1. Martire S, Banaszynski LA. The roles of histone variants in fine-tuning chromatin organization and function. Nat Rev Mol Cell Biol. 2020;21(9):522–41. - PMC - PubMed
    1. Waterborg JH. Evolution of histone H3: emergence of variants and conservation of post-translational modification sites. Biochem Cell Biol. 2012;90(1):79–95. - PubMed

LinkOut - more resources