

Identification of comorbid genes between type 2 diabetes and migraine through peripheral blood single-cell and Mendelian randomization analysis
- PMID: 40596821
- PMCID: PMC12220578
- DOI: 10.1186/s10194-025-02090-4
Identification of comorbid genes between type 2 diabetes and migraine through peripheral blood single-cell and Mendelian randomization analysis
Abstract
Background: Type 2 diabetes mellitus (T2DM) is a metabolic disorder characterized by hyperglycemia and insulin resistance, Migraine is a common chronic neurological disease caused by increased excitability of the central nervous system, both exerting substantial health burdens. However, the shared genetic basis and underlying molecular mechanisms remain largely unexplored. This study integrates single-cell data and Mendelian randomization (MR) analysis to identify comorbidity-associated genes and elucidate potential mechanistic links between these two conditions.
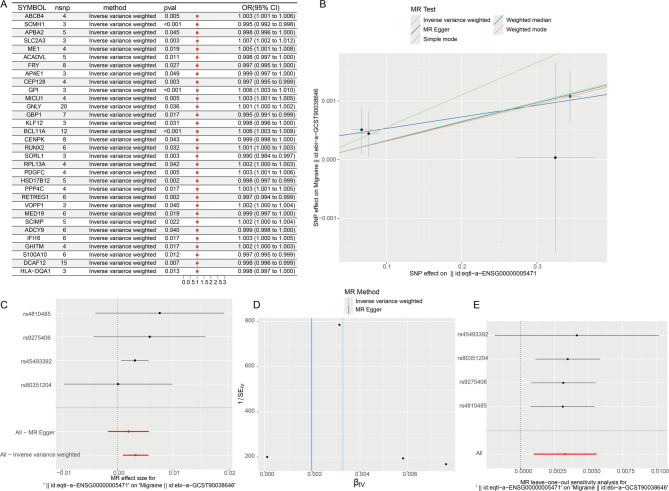
Methods: Single-cell datasets from T2DM and migraine were analyzed to identify differentially expressed genes (DEGs). MR analysis was employed to prioritize key causal genes, followed by network-based functional characterization, disease-drug association analysis, cell annotation, and pseudo-time trajectory modeling.
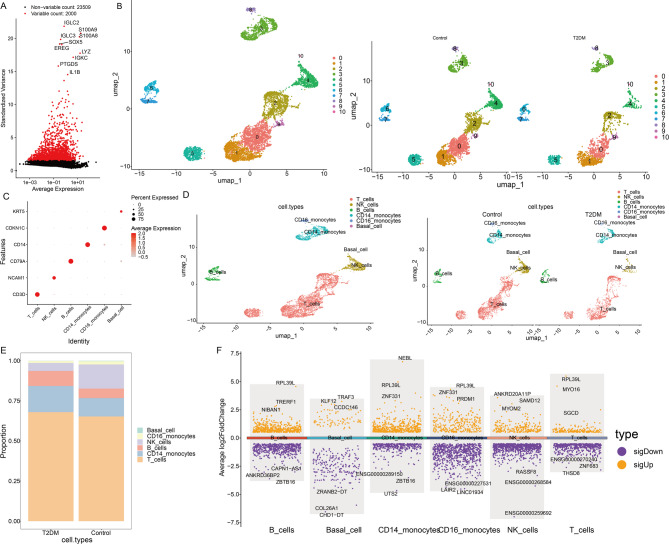
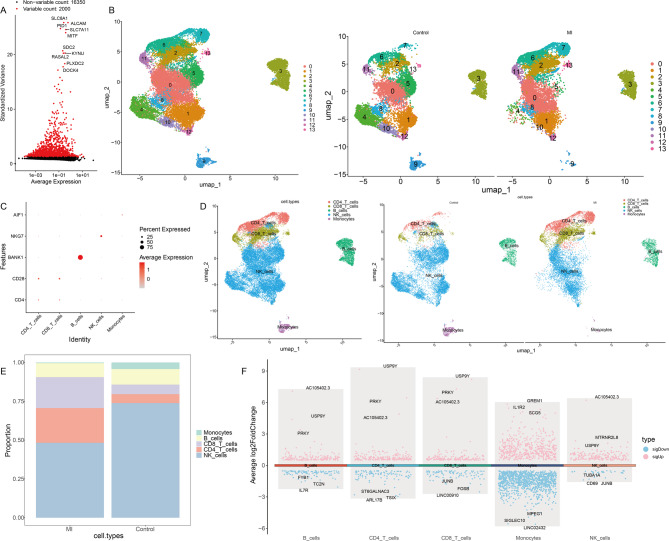
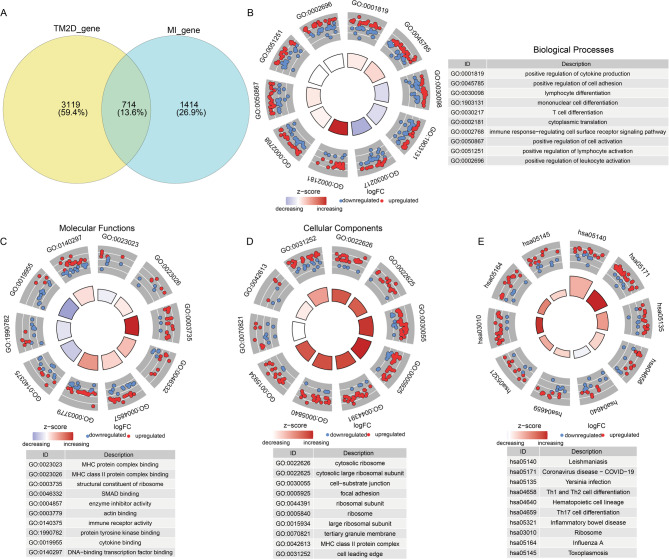
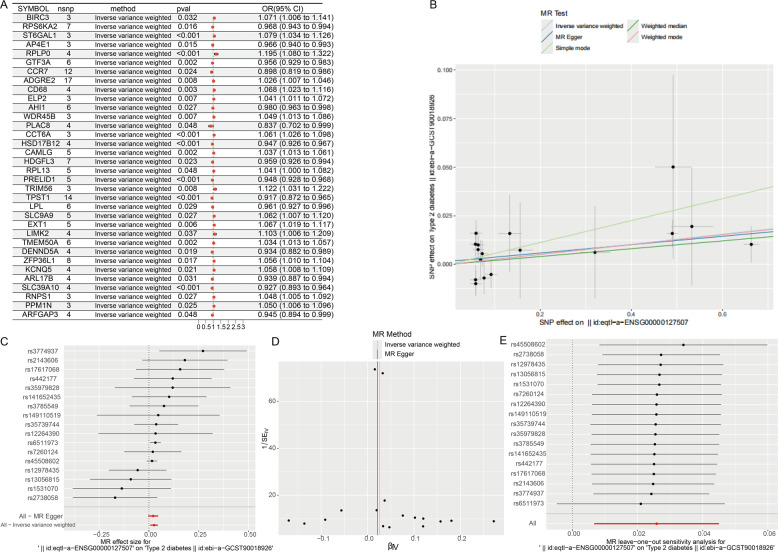
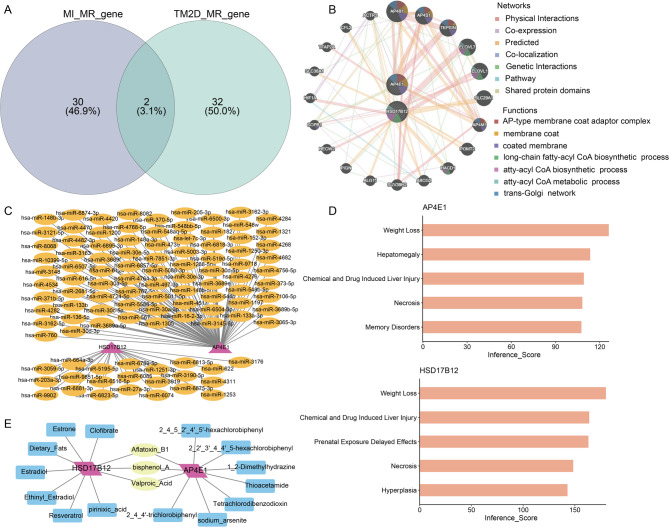
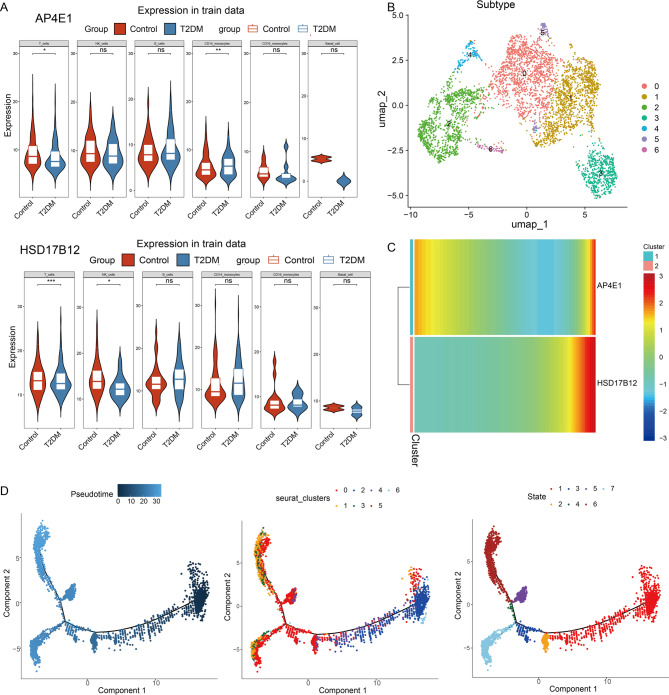
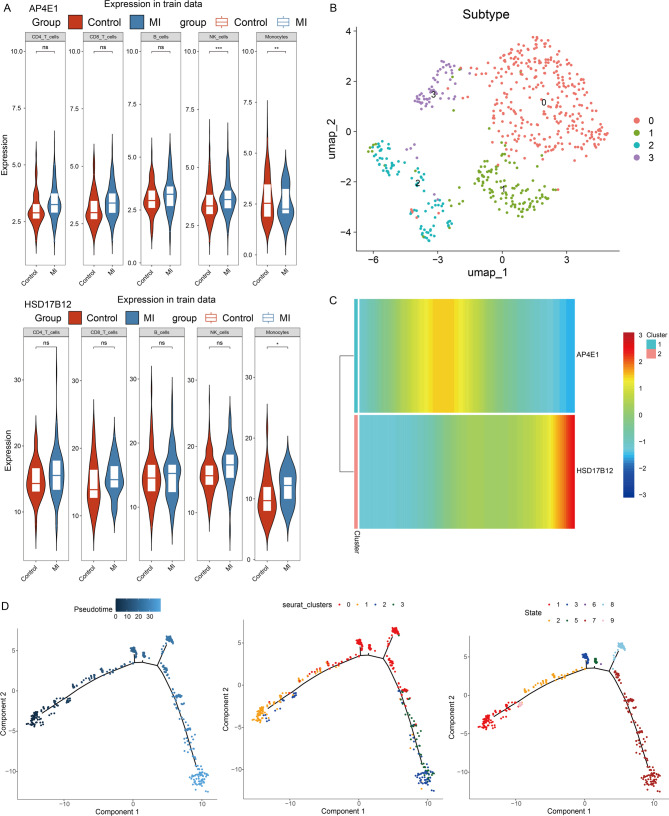
Results: Analysis of single-cell data identified 2,128 migraine-associated and 3,833 T2DM-associated genes, with 714 genes shared between the two diseases. MR analysis highlighted AP4E1 and HSD17B12 as key regulators implicated in both conditions. Network analysis further linked these genes to lipid metabolism and vesicle transport pathways. Computational predictions revealed common comorbidities, including metabolic dysregulation and chemical-induced liver injury, as well as potential therapeutic agents such as valproic acid and bisphenol A. Single-cell annotation identified six major immune cell types in T2DM (T cells, NK cells, B cells, CD14 monocytes, CD16 monocytes, and dendritic cells), with T cells emerging as central players. In migraine, five immune cell types were identified (CD4 T cells, CD8 T cells, B cells, NK cells, and monocytes), with monocytes being the predominant cell type. Pseudo-time analysis delineated seven subpopulations of T cells and four subpopulations of monocytes, suggesting distinct functional trajectories in disease pathogenesis. However, due to the use of peripheral blood-derived single-cell data, genes primarily expressed in the central nervous system, such as CALCA and RAMP1, could not be detected, limiting the identification of certain migraine-specific pathways.
Conclusions: This single-cell data and MR analysis investigation identifies AP4E1 and HSD17B12 as pivotal genetic determinants in T2DM-migraine comorbidity, shedding light on their molecular interplay and potential therapeutic relevance.
Keywords: Mendelian randomization analysis; Migraine; Single-cell data analysis; Type 2 diabetes mellitus.
© 2025. The Author(s).
Conflict of interest statement
Declarations. Ethics approval and consent to participate: Not applicable. Consent for publication: All data analyzed during this study have been previously published. Competing interests: The authors declare no competing interests.
Figures
References
-
- Holman N, Young B, Gadsby R (2015) Current prevalence of type 1 and type 2 diabetes in adults and children in the UK[J]. Diabet Med 32(9):1119–1120 - PubMed
MeSH terms
Grants and funding
LinkOut - more resources
Full Text Sources
Medical
Research Materials
