

NuclampFISH enables cell sorting based on nuclear RNA expression for chromatin analysis
- PMID: 40596885
- PMCID: PMC12210831
- DOI: 10.1186/s12864-025-11818-0
NuclampFISH enables cell sorting based on nuclear RNA expression for chromatin analysis
Abstract
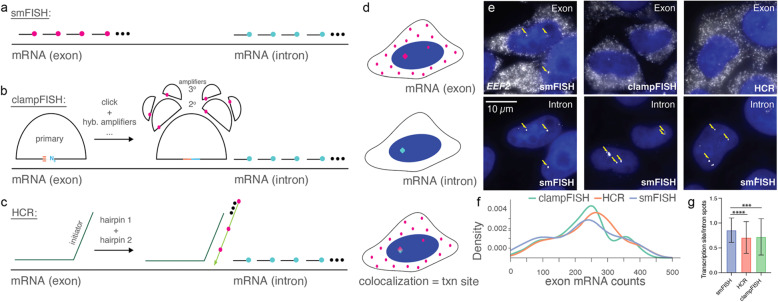
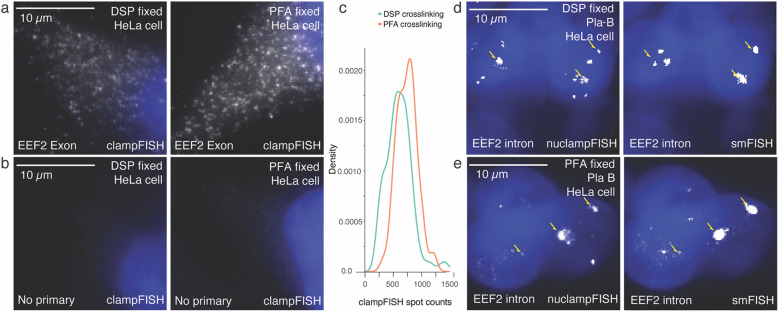
Background: Transcriptional bursts are periods when RNA polymerase interacts with a DNA locus, leading to active gene transcription. This bursting activity can vary across individual cells, and analyzing the differences in transcription sites can help identify key drivers of gene expression for a specific target RNA. Scaffolding methods based on fluorescence in situ hybridization (FISH) have been widely used to amplify the fluorescent signal of RNAs and sort cells based on RNA expression levels. Examples include click-amplifying FISH (clampFISH) and hybridization chain reaction (HCR). However, these methods are limited in their ability to target and amplify transcription sites, due to the long probes' hindered accessibility through cellular compartment membranes and crosslinked proteins. Thus, sorting based on transcriptional bursting has not been achieved. Additionally, the required formaldehyde fixation interferes with downstream analysis of chromatin and protein-binding interactions.
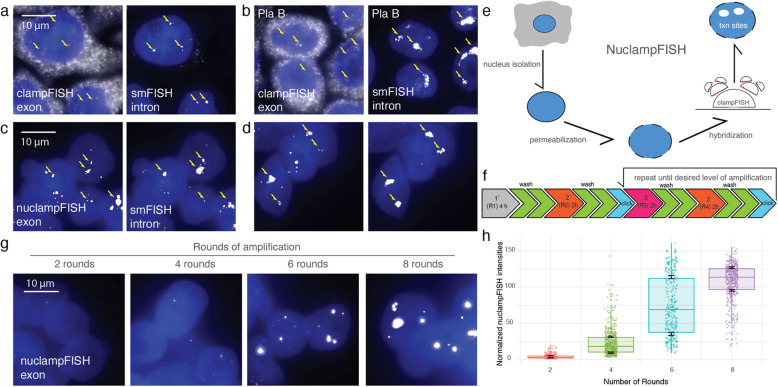
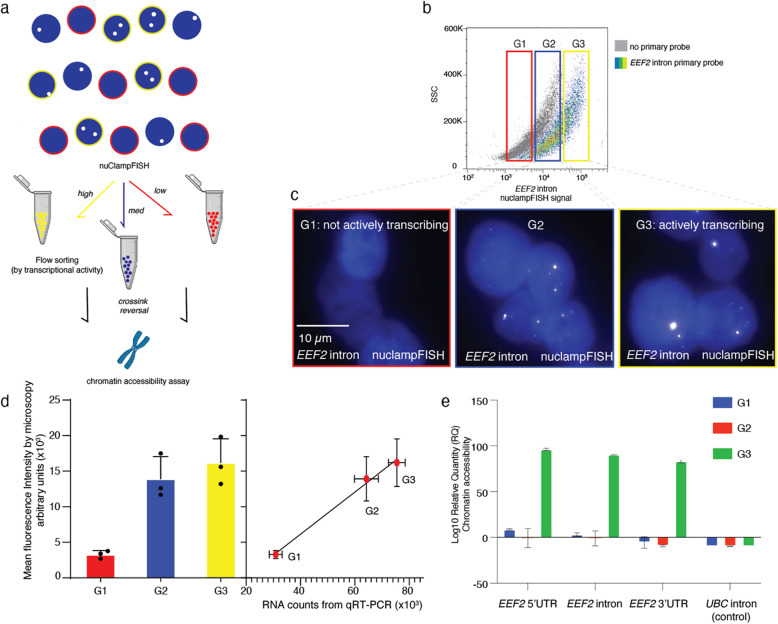
Results: To address these challenges, we developed a platform, nuclear clampFISH (nuclampFISH) that integrates click-amplified FISH with reversible crosslinkers and allows access to the nucleus. We demonstrate that with optimized parameters and by eliminating the cytosol and cell membrane, this method enables the amplification of fluorescent signal for RNAs using a reversible crosslinker, enabling the sorting of cells based on nuclear RNA expression and is compatible with downstream biochemical analysis including chromatin conformation assays. We applied this assay to demonstrate that transcriptionally active cells have more accessible chromatin for a respective gene.
Conclusions: This new method enables the sorting of cells based on transcriptional bursts. This method combines the specificity of a single-cell assay for detecting transcription sites with the throughput of flow cytometry to enable bulk assays such as chromatin conformation or other biochemical assays. Notably, the tools developed are highly accessible and do not require specialized computation or equipment.
Keywords: Chromatin conformation; ClampFISH; RNA FISH amplification; SmFISH; Transcription site; Transcriptional burst.
© 2025. The Author(s).
Conflict of interest statement
Declarations. Ethics approval and consent to participate: Not applicable. Consent for publication: Not applicable. Competing interests: The authors declare no competing interests.
Figures
Similar articles
-
Signs and symptoms to determine if a patient presenting in primary care or hospital outpatient settings has COVID-19.Cochrane Database Syst Rev. 2022 May 20;5(5):CD013665. doi: 10.1002/14651858.CD013665.pub3. Cochrane Database Syst Rev. 2022. PMID: 35593186 Free PMC article.
-
Comprehensive single-cell chromatin and transcriptomic profiling of peripheral immune cells in nonsegmental vitiligo.Br J Dermatol. 2025 Jun 20;193(1):115-124. doi: 10.1093/bjd/ljaf041. Br J Dermatol. 2025. PMID: 39888372
-
Diagnostic test accuracy and cost-effectiveness of tests for codeletion of chromosomal arms 1p and 19q in people with glioma.Cochrane Database Syst Rev. 2022 Mar 2;3(3):CD013387. doi: 10.1002/14651858.CD013387.pub2. Cochrane Database Syst Rev. 2022. PMID: 35233774 Free PMC article.
-
Can a Liquid Biopsy Detect Circulating Tumor DNA With Low-passage Whole-genome Sequencing in Patients With a Sarcoma? A Pilot Evaluation.Clin Orthop Relat Res. 2025 Jan 1;483(1):39-48. doi: 10.1097/CORR.0000000000003161. Epub 2024 Jun 21. Clin Orthop Relat Res. 2025. PMID: 38905450
-
The Lived Experience of Autistic Adults in Employment: A Systematic Search and Synthesis.Autism Adulthood. 2024 Dec 2;6(4):495-509. doi: 10.1089/aut.2022.0114. eCollection 2024 Dec. Autism Adulthood. 2024. PMID: 40018061 Review.
References
-
- Suter DM, Molina N, Gatfield D, Schneider K, Schibler U, Naef F. Mammalian genes are transcribed with widely different bursting kinetics. Science. 2011;332:472–4. - PubMed
MeSH terms
Substances
LinkOut - more resources
Full Text Sources
