

Non-invasive assessment of liver function in cirrhosis using iodine density difference between the portal vein and hepatic vein on spectral CT: correlation with Child-Pugh grades
- PMID: 40596902
- PMCID: PMC12220438
- DOI: 10.1186/s12880-025-01768-0
Non-invasive assessment of liver function in cirrhosis using iodine density difference between the portal vein and hepatic vein on spectral CT: correlation with Child-Pugh grades
Abstract
Objective: To explore the feasibility and clinical significance of assessing liver function damage in patients with post-hepatitis cirrhosis using spectral CT by measuring the iodine density difference and CT value difference between the portal vein and hepatic vein.
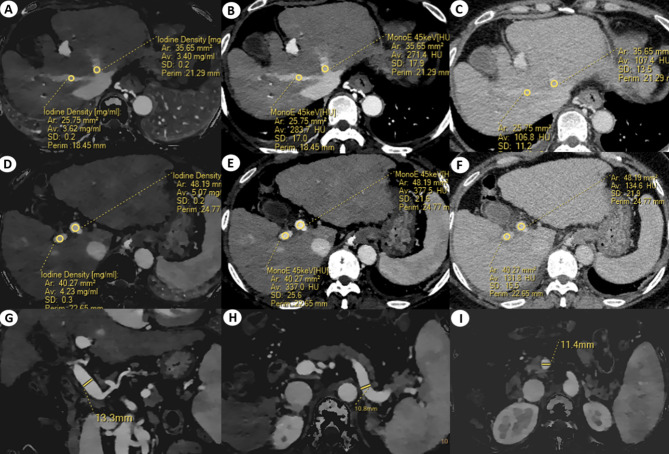
Methods: A study was conducted involving 65 patients with post-hepatitis cirrhosis (30 with Child-Pugh grade A, 28 with grade B, and 7 with grade C) and 82 healthy controls. All underwent dual-phase enhanced spectral CT scans of the upper abdomen. Post-processing with IntelliSpace Portal software yielded iodine density (ID), 45 keV virtual monoenergetic (VMI), and conventional CT (HU) images. The mean iodine densities of the portal vein (IDP) and hepatic vein (IDV) were measured, and the difference in ID (IDd-value), VMI (VMId-value), and HU (HUd-value) between the portal vein and hepatic vein was calculated. These values were compared between the control group and different Child-Pugh grades of cirrhosis, as well as between the compensated cirrhosis group (Child-Pugh grade A) and the decompensated cirrhosis group (grade B/C). The ability to diagnose decompensated cirrhosis was evaluated by plotting ROC curves.
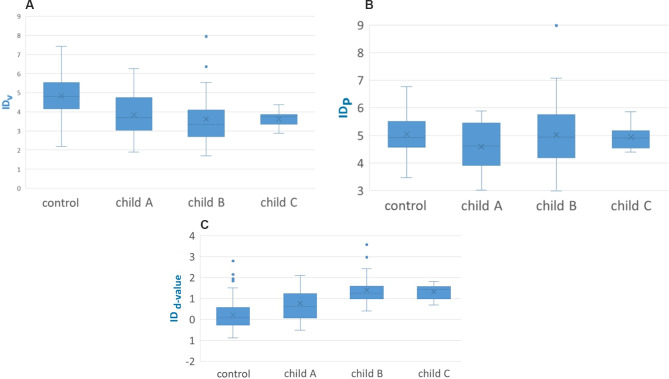
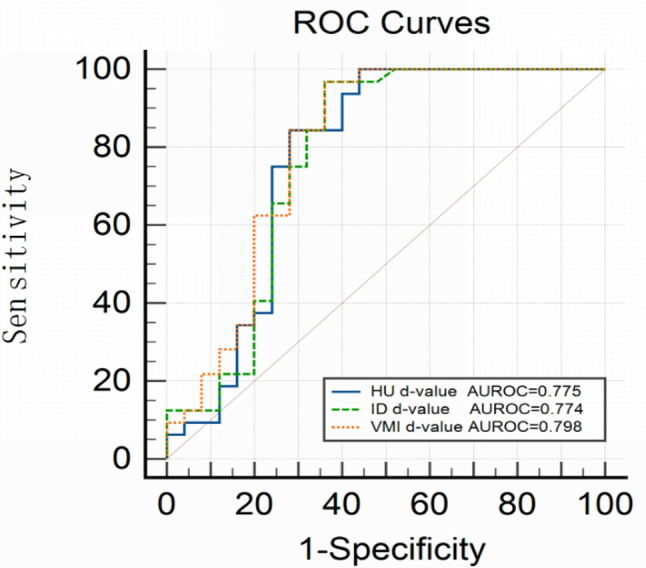
Results: The IDd-value, VMId-value, and HU d-value were significantly higher in the cirrhosis group compared to the control group and were also higher in the grade B/C group compared to the grade A group (all p<0.05). Among all patients with cirrhosis, the AUROC values for diagnosing grade B/C using IDd-value, VMId-value, HUd-value, NIDd-value, NVMI d-value, and NHUd-value were 0.774, 0.798, 0.736, 0.775, 0.774, and 0.757, respectively (all p < 0.05).
Conclusions: The iodine density difference (IDd-value) and CT value difference (VMId-value and HU d-value) between the portal vein and hepatic vein, as measured by spectral CT, demonstrate a significant positive correlation with the Child-Pugh classification of liver function in cirrhotic patients. These quantitative parameters provide a simple and non-invasive approach for assessing liver function in cirrhotic patients.
Clinical trial number: Not applicable.
Keywords: Hepatic vein; Iodine density; Liver cirrhosis; Liver function; Portal vein; Spectral CT.
© 2025. The Author(s).
Conflict of interest statement
Declarations. Ethics approval and consent to participate: This retrospective non-intervention study was approved by the Ethics Committee of The First Affiliated Hospital of Sun Yat-sen University (number [2024] 638). In accordance with the principles of the Declaration of Helsinki, the informed consent to participate for retrospective non-intervention study can be waived in our hospital. Consent for publication: Not applicable. Competing interests: The authors declare no competing interests.
Figures
Similar articles
-
The correlation between metabolic dysfunction-associated steatotic liver disease (MASLD) grades and hemodynamic alterations of the portal, hepatic, and splenic vein and spleen size.J Ultrasound. 2025 Jun;28(2):339-347. doi: 10.1007/s40477-024-00965-x. Epub 2024 Nov 13. J Ultrasound. 2025. PMID: 39537958
-
Assessment of high-risk gastroesophageal varices in cirrhotic patients using quantitative parameters from dual-source dual-energy CT.Abdom Radiol (NY). 2025 Jul;50(7):2783-2793. doi: 10.1007/s00261-024-04666-1. Epub 2024 Nov 15. Abdom Radiol (NY). 2025. PMID: 39542947
-
Prevalence of portal vein thrombosis in pediatric patients with cirrhosis and intrahepatic non-cirrhotic portal hypertension.Dig Liver Dis. 2025 Jul;57(7):1451-1454. doi: 10.1016/j.dld.2025.04.038. Epub 2025 May 10. Dig Liver Dis. 2025. PMID: 40350344
-
Platelet count, spleen length, and platelet count-to-spleen length ratio for the diagnosis of oesophageal varices in people with chronic liver disease or portal vein thrombosis.Cochrane Database Syst Rev. 2017 Apr 26;4(4):CD008759. doi: 10.1002/14651858.CD008759.pub2. Cochrane Database Syst Rev. 2017. PMID: 28444987 Free PMC article.
-
Granulocyte colony-stimulating factor with or without stem or progenitor cell or growth factors infusion for people with compensated or decompensated advanced chronic liver disease.Cochrane Database Syst Rev. 2023 Jun 6;6(6):CD013532. doi: 10.1002/14651858.CD013532.pub2. Cochrane Database Syst Rev. 2023. PMID: 37278488 Free PMC article.
References
-
- Zipprich A, Steudel N, Behrmann C, et al. Functional significance of hepatic arterial flow reserve in patients with cirrhosis. Hepatology. 2003;37(2):385–92. - PubMed
-
- Xingjiang W, Weiwei D, Jianmin C, et al. Functional hepatic flow can predict the hepatic reserve function in surgical cirrhotic patients. J Invest Surg. 2009;22(3):178–82. - PubMed
-
- Gao WT, Li YM Ji H, Yang WB. Evaluating liver functional reserve by combining D-sorbitol with indocyanine green measurement. Zhonghua Gan Zang Bing Za Zhi. 2003;11(6):350–3. - PubMed
-
- Miles KA, Hayball MP, Dixon AK. Functional images of hepatic perfusion obtained with dynamic CT. Radiology. 1993;188(2):405–11. - PubMed
-
- Zhang Y, Zhang XM, Prowda JC, et al. Changes in hepatic venous morphology with cirrhosis on MRI. J Magn Reson Imaging. 2009;29(5):1085–92. - PubMed
MeSH terms
Substances
LinkOut - more resources
Full Text Sources
Medical
