

Development and validation of CT-based fusion model for preoperative prediction of invasion and lymph node metastasis in adenocarcinoma of esophagogastric junction
- PMID: 40596905
- PMCID: PMC12220218
- DOI: 10.1186/s12880-025-01777-z
Development and validation of CT-based fusion model for preoperative prediction of invasion and lymph node metastasis in adenocarcinoma of esophagogastric junction
Abstract
Purpose: In the context of precision medicine, radiomics has become a key technology in solving medical problems. For adenocarcinoma of esophagogastric junction (AEG), developing a preoperative CT-based prediction model for AEG invasion and lymph node metastasis is crucial.
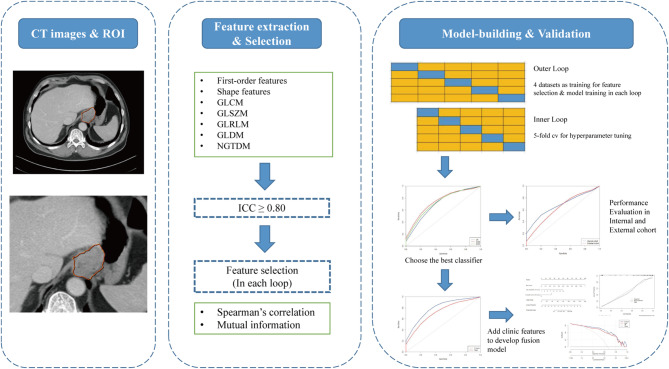
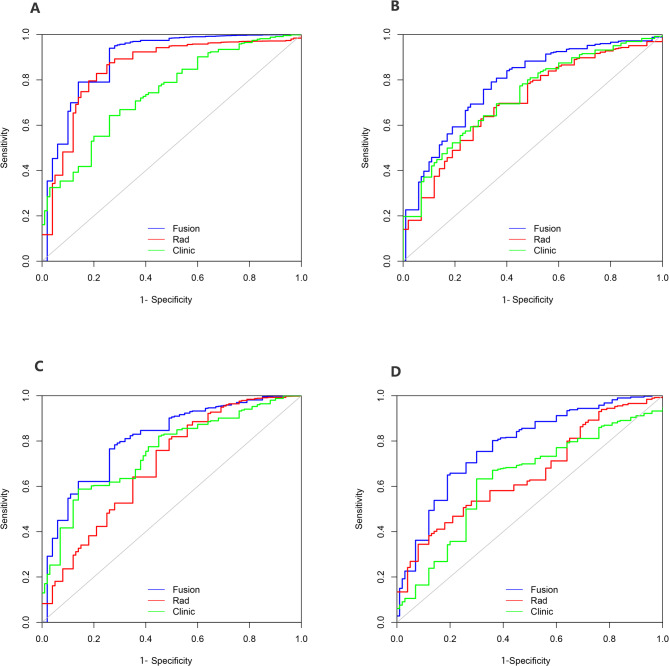
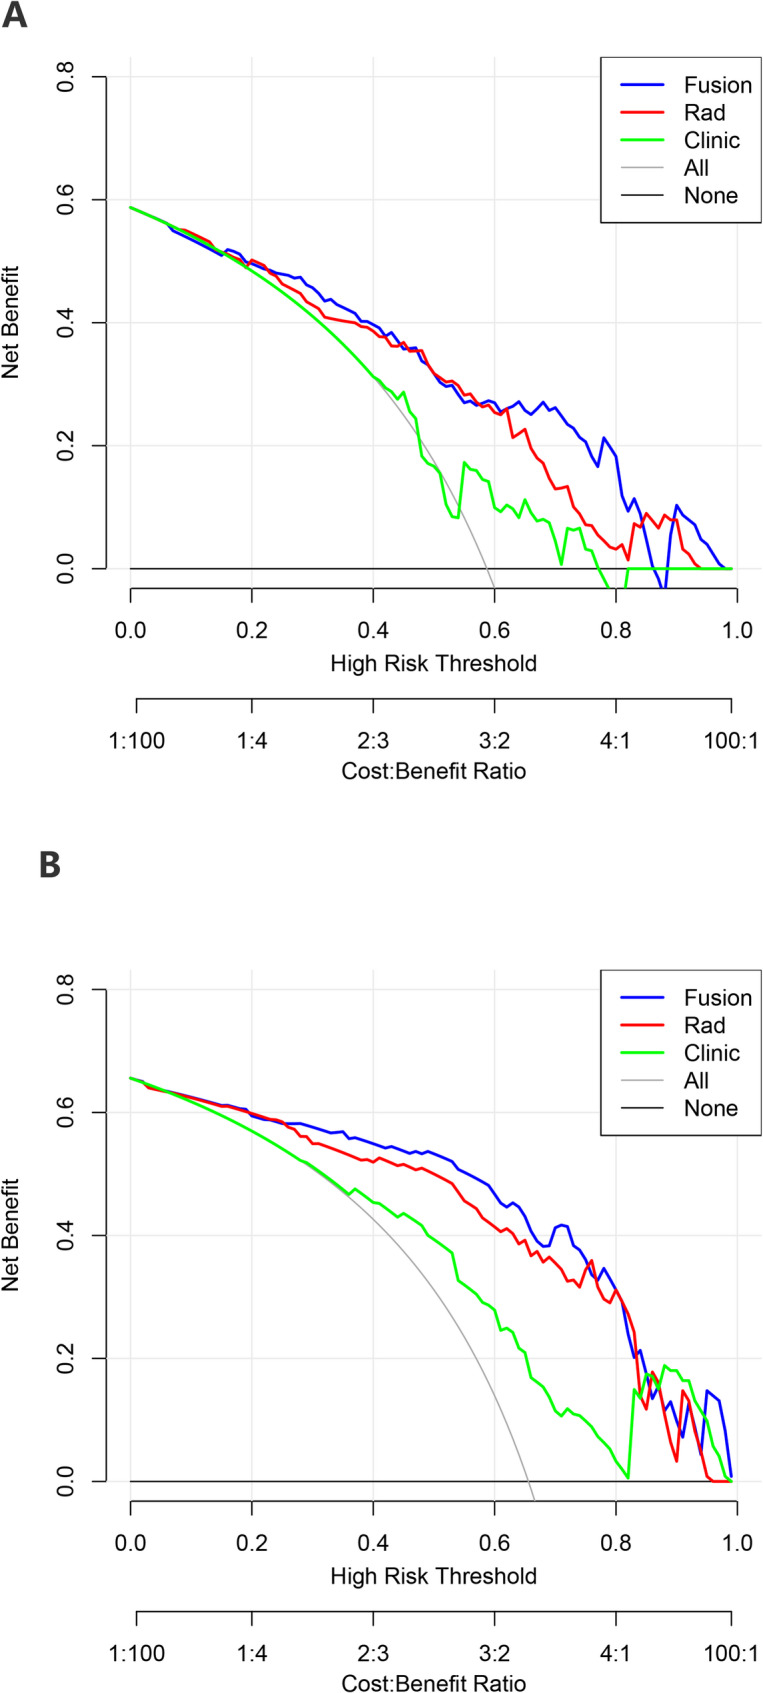
Methods: We retrospectively collected 256 patients with AEG from two centres. The radiomics features were extracted from the preoperative diagnostic CT images, and the feature selection method and machine learning method were applied to reduce the feature size and establish the predictive imaging features. By comparing the three machine learning methods, the best radiomics nomogram was selected, and the average AUC was obtained by 20 repeats of fivefold cross-validation for comparison. The fusion model was constructed by logistic regression combined with clinical factors. On this basis, ROC curve, calibration curve and decision curve of the fusion model are constructed.
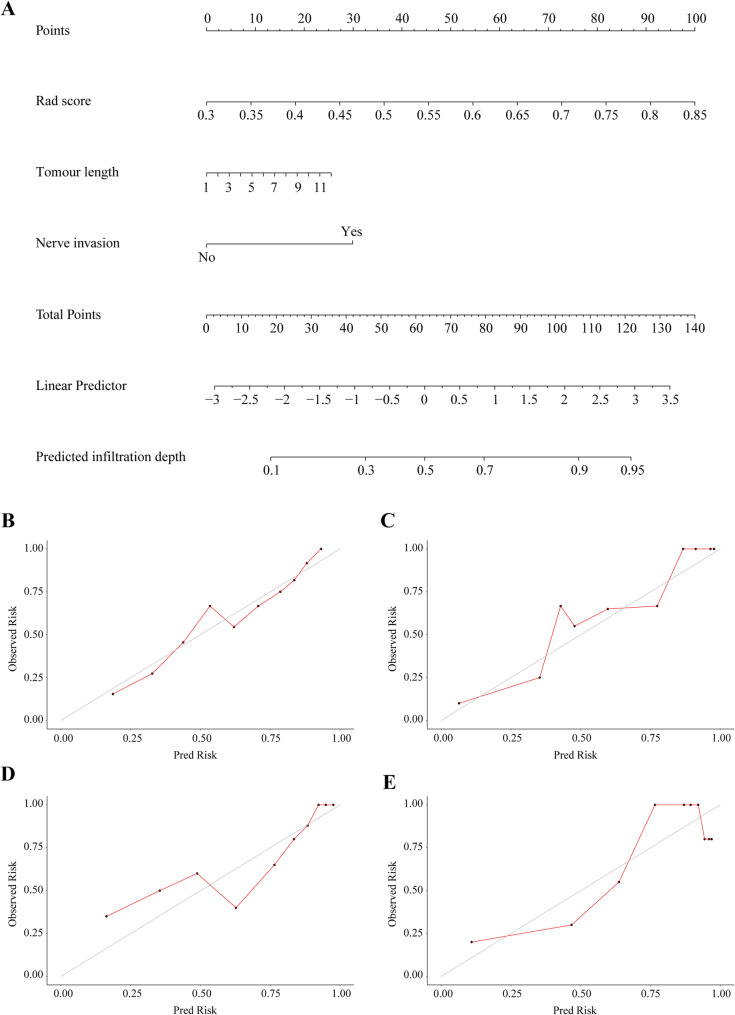
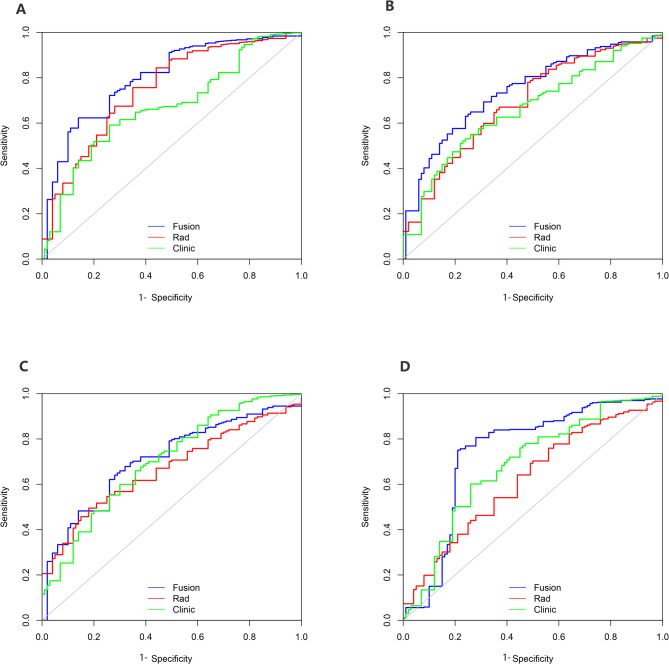
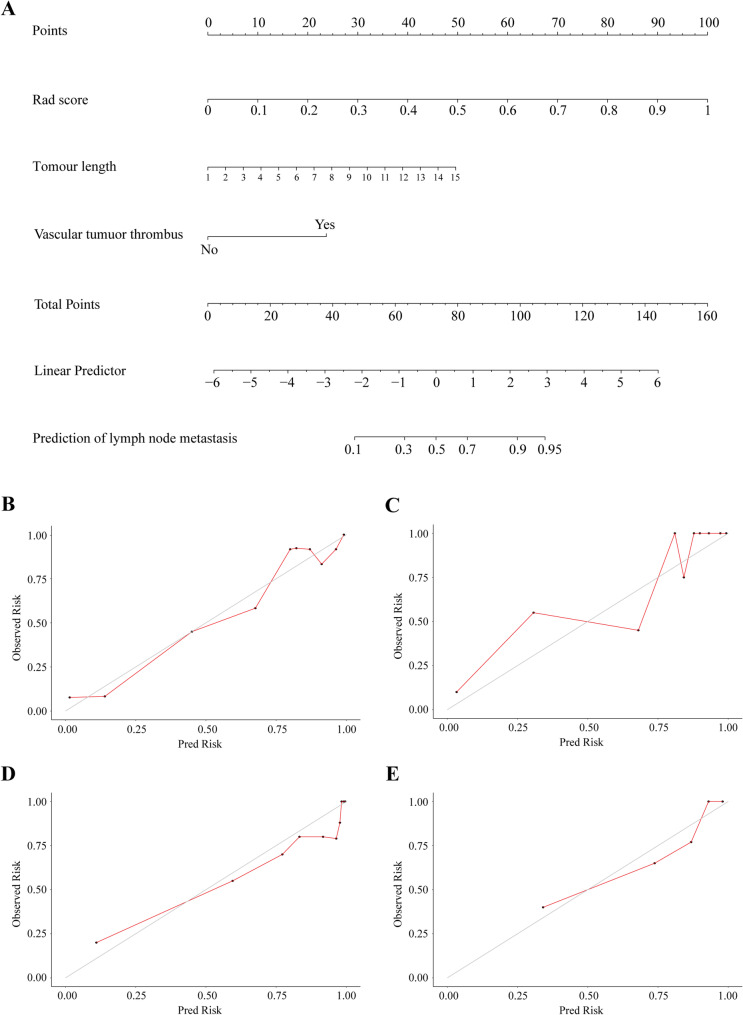
Results: The predictive efficacy of fusion model for tumour invasion depth was higher than that of radiomics nomogram, with an AUC of 0.764 vs. 0.706 in the test set, P < 0.001, internal validation set 0.752 vs. 0.697, P < 0.001, and external validation set 0.756 vs. 0.687, P < 0.001, respectively. The predictive efficacy of the lymph node metastasis fusion model was higher than that of the radiomics nomogram, with an AUC of 0.809 vs. 0.732 in the test set, P < 0.001, internal validation set 0.841 vs. 0.718, P < 0.001, and external validation set 0.801 vs. 0.680, P < 0.001, respectively.
Conclusion: We have developed a fusion model combining radiomics and clinical risk factors, which is crucial for the accurate preoperative diagnosis and treatment of AEG, advancing precision medicine. It may also spark discussions on the imaging feature differences between AEG and GC (Gastric cancer).
Keywords: Adenocarcinoma of esophagogastric junction (AEG); Fusion model; Lymph node metastasis; Prediction; Radiomics nomogram; Serous invasion.
© 2025. The Author(s).
Conflict of interest statement
Declarations. Ethics approval and consent to participate: This study was undertaken in accordance with the World Medical Association. Declaration of Helsinki- ethical principles for medical research, and the study was approved by research ethics committee of the Zhejiang Cancer Hospital (IRB-2022-371). All patients gave their informed consent. Consent for publication: Not applicable. Competing interests: The authors declare no competing interests.
Figures
Similar articles
-
CT Scans Understage Lymph Nodes in Gastric and Gastroesophageal Adenocarcinoma.J Surg Oncol. 2025 Jun;131(8):1571-1579. doi: 10.1002/jso.28112. Epub 2025 Mar 28. J Surg Oncol. 2025. PMID: 40152813 Free PMC article.
-
Radiomics Nomogram Based on Optimal Volume of Interest Derived from High-Resolution CT for Preoperative Prediction of IASLC Grading in Clinical IA Lung Adenocarcinomas: A Multi-Center, Large-Population Study.Technol Cancer Res Treat. 2024 Jan-Dec;23:15330338241300734. doi: 10.1177/15330338241300734. Technol Cancer Res Treat. 2024. PMID: 39569528 Free PMC article.
-
Spectral CT radiomics features of the tumor and perigastric adipose tissue can predict lymph node metastasis in gastric cancer.Abdom Radiol (NY). 2025 Aug;50(8):3435-3446. doi: 10.1007/s00261-025-04807-0. Epub 2025 Jan 25. Abdom Radiol (NY). 2025. PMID: 39862285 Free PMC article.
-
Cost-effectiveness of using prognostic information to select women with breast cancer for adjuvant systemic therapy.Health Technol Assess. 2006 Sep;10(34):iii-iv, ix-xi, 1-204. doi: 10.3310/hta10340. Health Technol Assess. 2006. PMID: 16959170
-
Diagnostic accuracy of CT and PET/CT radiomics in predicting lymph node metastasis in non-small cell lung cancer.Eur Radiol. 2025 Apr;35(4):1966-1979. doi: 10.1007/s00330-024-11036-4. Epub 2024 Sep 2. Eur Radiol. 2025. PMID: 39223336
References
-
- Ajani JA, Barthel JS, Bentrem DJ, D’Amico TA, Das P, Denlinger CS, Fuchs CS, Gerdes H, Glasgow RE, Hayman JA, et al. Esophageal and esophagogastric junction cancers. J Natl Compr Cancer Network: JNCCN. 2011;9(8):830–87. - PubMed
-
- Pera M. Epidemiology of esophageal cancer, especially adenocarcinoma of the esophagus and esophagogastric junction. Recent results in cancer research fortschritte der krebsforschung progres Dans Les recherches Sur Le cancer 2000, 155:1–14. - PubMed
-
- [Chinese expert consensus on the surgical treatment for adenocarcinoma. Of esophagogastric junction (Edition 2024)]. Zhonghua Wei Chang Wai Ke Za zhi = chinese journal of Gastrointestinal surgery 2024, 27(2):109–26. - PubMed
-
- Siewert JR, Feith M, Stein HJ. Biologic and clinical variations of adenocarcinoma at the esophago-gastric junction: relevance of a topographic-anatomic subclassification. J Surg Oncol. 2005;90(3):139–46. discussion 146. - PubMed
-
- Daiko H, Kato K. Updates in the 8th edition of the TNM staging system for esophagus and esophagogastric junction cancer. Jpn J Clin Oncol. 2020;50(8):847–51. - PubMed
Publication types
MeSH terms
LinkOut - more resources
Full Text Sources
Medical
Miscellaneous
