

The value of diagnosing coronary slow flow based on epicardial adipose tissue radiomics in chest computed tomography
- PMID: 40596922
- PMCID: PMC12220545
- DOI: 10.1186/s12880-025-01792-0
The value of diagnosing coronary slow flow based on epicardial adipose tissue radiomics in chest computed tomography
Abstract
Background: At present, the diagnosis of coronary slow flow (CSF) relies on coronary angiography, and non-invasive imaging examinations for the diagnosis of CSF have not been fully studied. This study aimed to explore the value of diagnosing CSF based on epicardial adipose tissue (EAT) radiomics in chest computed tomography (CT).
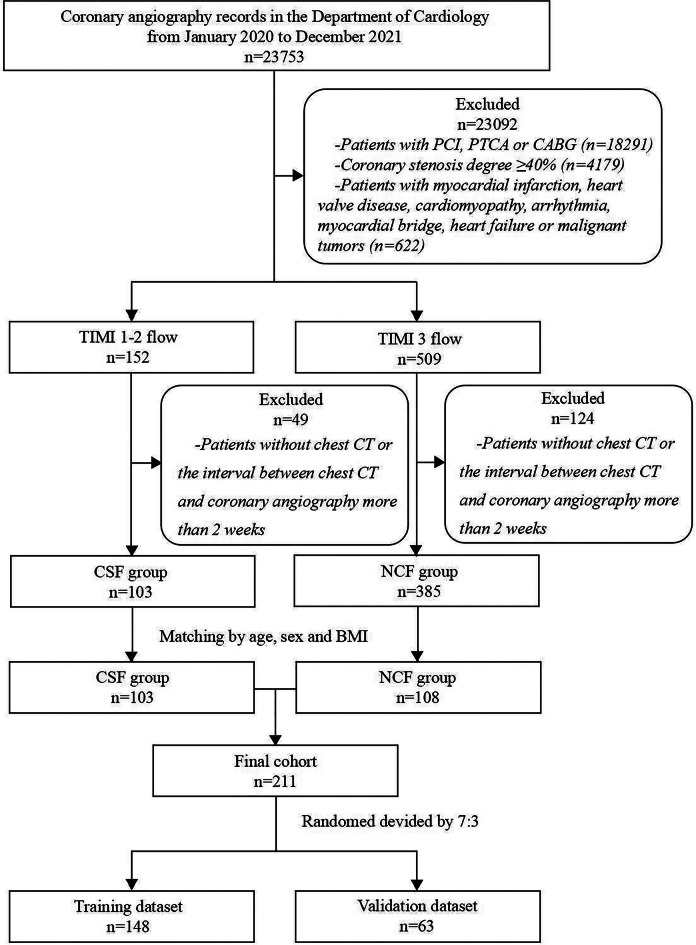
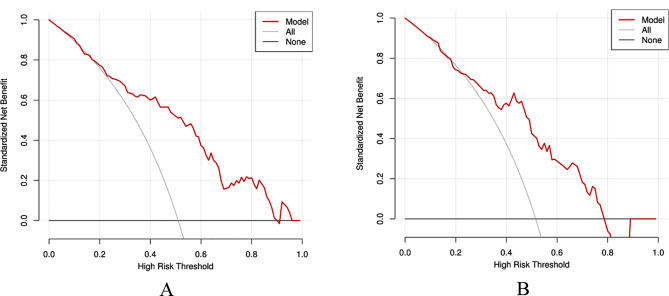
Methods: This retrospective study included 211 patients who underwent coronary angiography showing coronary artery stenosis < 40% from January 2020 to December 2021 and underwent chest CT within 2 weeks before angiography. According to the thrombolysis in myocardial infarction flow grade, the patients were divided into CSF group (n = 103) and normal coronary flow group (n = 108). Establish an automatic method for segmenting EAT on chest CT images. Patients were randomly divided into a training set (n = 148) and a validation set (n = 63) at a ratio of 7:3, and then radiomics features were extracted. Features selected using the maximum relevance minimum redundancy and the least absolute shrinkage and selection operator were adopted to construct an EAT radiomics model. The diagnostic efficacy of the model for CSF was evaluated using the area under the receiver operating characteristic curve. The consistency between the model and the actual results was evaluated using calibration curves, and the clinical application value of the model was evaluated using decision curve analysis.
Results: 16 radiomics features were retained to establish an EAT radiomics model for diagnosing CSF. The model had an AUC of 0.81, sensitivity of 0.72, specificity of 0.79, and accuracy of 0.76 for diagnosing CSF in the training set, and an AUC of 0.77, sensitivity of 0.82, specificity of 0.71, and accuracy of 0.77 in the validation set. The calibration curves showed good consistency between the model and the actual results, while the decision analysis curves showed good overall net benefits of the model within most reasonable threshold probability ranges.
Conclusions: The EAT radiomics model based on chest CT had good diagnostic efficacy for CSF and may become a potential non-invasive tool for diagnosing CSF.
Keywords: Computed tomography; Coronary slow flow; Epicardial adipose tissue; Radiomics.
© 2025. The Author(s).
Conflict of interest statement
Declarations. Ethics approval and consent to participate: The study protocol was approved by the ethics committee of the General Hospital of Northern Theater Command (Y[2022]013) and the study complied with the Declaration of Helsinki. Informed consent was waived by the ethics committee of the General Hospital of Northern Theater Command because of the retrospective nature of this study. Consent for publication: Not applicable. Competing interests: The authors declare that they have no competing interests.
Figures


Similar articles
-
Predicting abnormal epicardial adipose tissue in psoriasis patients by integrating radiomics from non-contrast chest CT with serological biomarkers.BMC Med Imaging. 2025 Jul 1;25(1):240. doi: 10.1186/s12880-025-01755-5. BMC Med Imaging. 2025. PMID: 40597754 Free PMC article.
-
[Predictive value of CT-based tumor and peritumoral radiomics for WHO/ISUP grading of non-metastatic clear cell renal cell carcinoma].Zhonghua Yi Xue Za Zhi. 2025 Jul 15;105(26):2195-2202. doi: 10.3760/cma.j.cn112137-20250226-00460. Zhonghua Yi Xue Za Zhi. 2025. PMID: 40660974 Chinese.
-
Radiomics and deep learning features of pericoronary adipose tissue on non-contrast computerized tomography for predicting non-calcified plaques.J Xray Sci Technol. 2025 Jan;33(1):96-108. doi: 10.1177/08953996241292476. Epub 2024 Dec 18. J Xray Sci Technol. 2025. PMID: 39973776
-
Systematic review of the clinical effectiveness and cost-effectiveness of 64-slice or higher computed tomography angiography as an alternative to invasive coronary angiography in the investigation of coronary artery disease.Health Technol Assess. 2008 May;12(17):iii-iv, ix-143. doi: 10.3310/hta12170. Health Technol Assess. 2008. PMID: 18462576
-
Thoracic imaging tests for the diagnosis of COVID-19.Cochrane Database Syst Rev. 2022 May 16;5(5):CD013639. doi: 10.1002/14651858.CD013639.pub5. Cochrane Database Syst Rev. 2022. PMID: 35575286 Free PMC article.
References
-
- Tambe AA, Demany MA, Zimmerman HA, Mascarenhas E. Angina pectoris and slow flow velocity of dye in coronary arteries–a new angiographic finding. Am Heart J. 1972;84(1):66–71. - PubMed
-
- Beltrame JF. Defining the slow flow phenomenon. Circ J. 2012;76(4):818–20. - PubMed
-
- Hawkins BM, Stavrakis S, Rousan TA, Abu-Fadel M, Schechter E. Coronary slow flow–prevalence and clinical correlations. Circ J. 2012;76(4):936–42. - PubMed
MeSH terms
LinkOut - more resources
Full Text Sources
Medical
