Growth trajectories of children and adolescents with osteogenesis imperfecta in a reference center in Rio de janeiro, Brazil
- PMID: 40596949
- PMCID: PMC12220332
- DOI: 10.1186/s12887-025-05838-8
Growth trajectories of children and adolescents with osteogenesis imperfecta in a reference center in Rio de janeiro, Brazil
Abstract
Background: Osteogenesis Imperfecta (OI) is a rare genetic disorder affecting collagen production, crucial for bone and connective tissue. Monitoring growth in children with OI is essential for detecting comorbidities. Despite common stature deficits, specific growth charts are crucial for sensitively tracking changes and identifying additional issues in this population. The aim of this study is to evaluate weight, height and BMI trajectories in Brazilian patients with Osteogenesis Imperfecta (OI), proposing specific growth charts.
Methods: Weight and height repeated measures from birth to 19 years old were collected from medical records of all patients with OI treated in a reference center in Rio de Janeiro, Brazil. The GAMLSS statistical package (R software) was used to generate charts of weight-for-age, height-for-age and BMI-for-age, stratified for gender and OI subtype. Charts were compared to the World Health Organization (WHO) standards. The association with other variables was investigated using linear mixed effects regression.
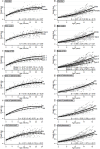
Results: 237 participants were included (type I = 134; type III = 41, type IV = 57; type V = 5). Factors associated with growth were: gender, OI subtype, pamidronate use, and rod placement. In type I, weight and height trajectories followed the pattern of WHO standards, but with a deficit in both genders. The growth of types III and IV was significantly lower compared to type I only after 2 years old for weight and all over the period for height. In general, there is greater impairment of height than weight, so the BMI chart is closer to the WHO standard, sometimes even surpassing it, especially in more severe phenotypes.
Conclusion: Children and adolescents with OI have compromised anthropometric measures and their nutritional evaluation must be done by specific growth charts. This work is an important step towards facilitating the clinical evaluation of these patients and can be used as reference for Brazilian population.
Keywords: Adolescents; Anthropometric measures; Children; Growth charts; Osteogenesis imperfecta.
© 2025. The Author(s).
Conflict of interest statement
Declarations. Ethics approval and consent to participate: The study is part of a larger research entitled “Reference Center on Osteogenesis Imperfecta (CROI)– Clinical and therapeutic protocols for Osteogenesis Imperfecta”, approved by the Institutional Review Board from the Fernandes Figueira Institute (5269 - Instituto Fernandes Figueira - IFF/ FIOCRUZ - RJ/ MS). The participants signed an informed consent form. Consent for publication: Not applicable. Competing interests: The authors declare no competing interests.
Figures


References
-
- Bonafe L, Cormier-Daire V, Hall C, Lachman R, Mortier G, Mundlos S, et al. Nosology and classification of genetic skeletal disorders: 2015 revision. Am J Med Genet A. 2015;167A:2869–92. - PubMed
-
- Germain-Lee EL, Brennen F-S, Stern D, Kantipuly A, Melvin P, Terkowitz MS, et al. Cross-sectional and longitudinal growth patterns in osteogenesis imperfecta: implications for clinical care. Pediatr Res. 2016;79:489–95. - PubMed
MeSH terms
LinkOut - more resources
Full Text Sources
Medical

