

Computed tomography-based radiomics predicts prognostic and treatment-related levels of immune infiltration in the immune microenvironment of clear cell renal cell carcinoma
- PMID: 40596969
- PMCID: PMC12211520
- DOI: 10.1186/s12880-025-01749-3
Computed tomography-based radiomics predicts prognostic and treatment-related levels of immune infiltration in the immune microenvironment of clear cell renal cell carcinoma
Abstract
Objectives: The composition of the tumour microenvironment is very complex, and measuring the extent of immune cell infiltration can provide an important guide to clinically significant treatments for cancer, such as immune checkpoint inhibition therapy and targeted therapy. We used multiple machine learning (ML) models to predict differences in immune infiltration in clear cell renal cell carcinoma (ccRCC), with computed tomography (CT) imaging pictures serving as a model for machine learning. We also statistically analysed and compared the results of multiple typing models and explored an excellent non-invasive and convenient method for treatment of ccRCC patients and explored a better, non-invasive and convenient prediction method for ccRCC patients.
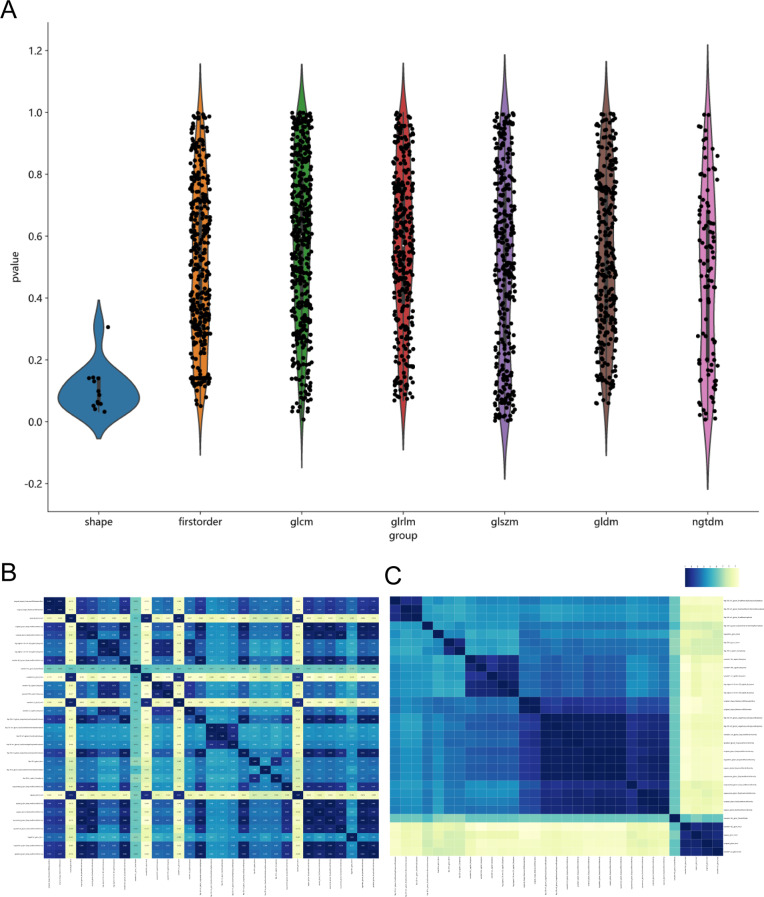
Methods: The study included 539 ccRCC samples with clinicopathological information and associated genetic information from The Cancer Genome Atlas (TCGA) database. The Single Sample Gene Set Enrichment Analysis (ssGSEA) algorithm was used to obtain the immune cell infiltration results as well as the cluster analysis results. ssGSEA-based analysis was used to obtain the immune cell infiltration levels, and the Boruta algorithm was further used to downscale the obtained positive/negative gene sets to obtain the immune infiltration level groupings. Multifactor Cox regression analysis was used to calculate the immunotherapy response of subgroups according to Tumor Immune Dysfunction and Exclusion (TIDE) algorithm and subgraph algorithm to detect the difference in survival time and immunotherapy response of ccRCC patients with immune infiltration. Radiomics features were screened using LASSO analysis. Eight ML algorithms were selected for diagnostic analysis of the test set. Receiver operating characteristic (ROC) curve was used to evaluate the performance of the model. Draw decision curve analysis (DCA) to evaluate the clinical personalized medical value of the predictive model.
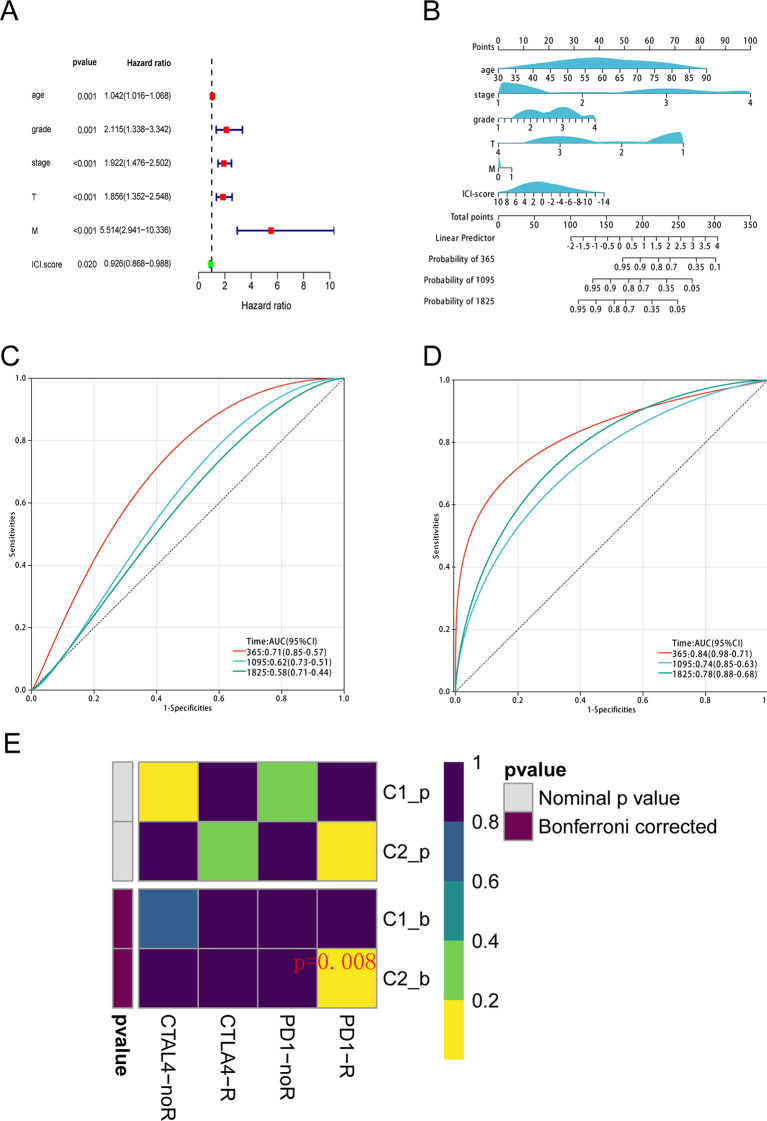
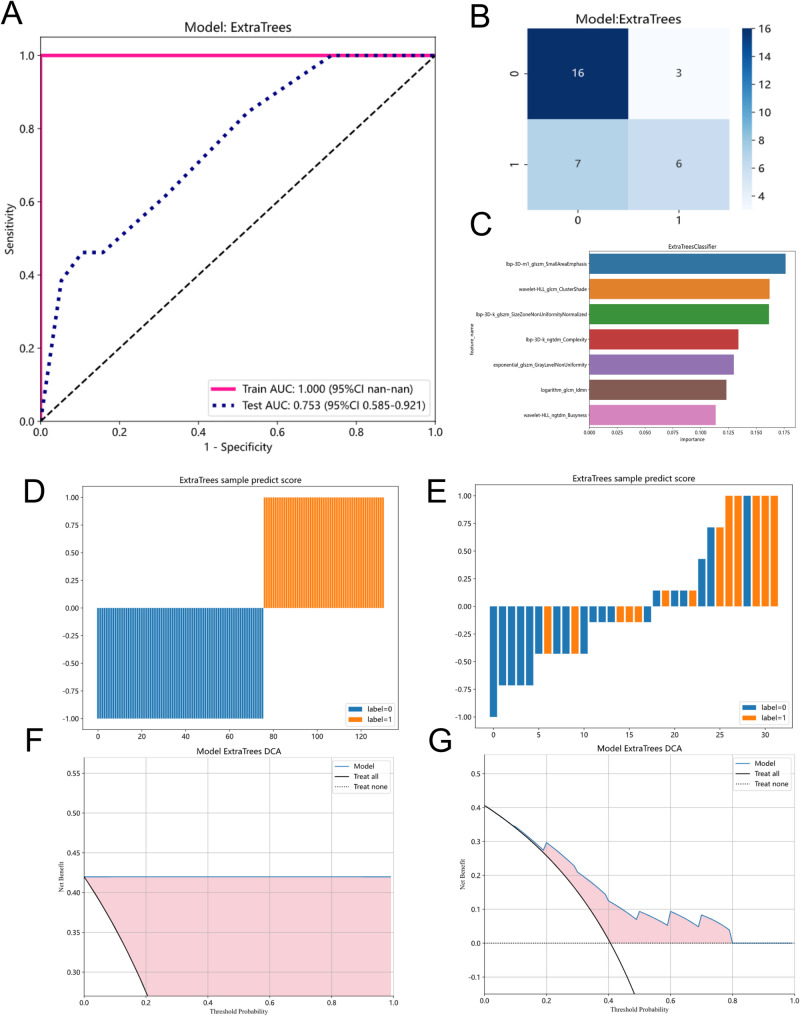
Results: The high/low subtypes of immune infiltration levels obtained by optimisation based on the Boruta algorithm were statistically different in the survival analysis of ccRCC patients. Multifactorial immune infiltration level combined with clinical factors better predicted survival of ccRCC patients, and ccRCC with high immune infiltration may benefit more from anti-PD-1 therapy. Among the eight machine learning models, ExtraTrees had the highest test and training set ROC AUCs of 1.000 and 0.753; in the test set, LR and LightGBM had the highest sensitivity of 0.615; LR, SVM, ExtraTrees, LightGBM and MLP had higher specificities of 0.789, 1.000, 0.842, 0.789 and 0.789, respectively; and LR, ExtraTrees and LightGBM had the highest accuracy of 0. 719, 0.688 and 0.719 respectively. Therefore, the CT-based ML achieved good predictive results in predicting immune infiltration in ccRCC, with the ExtraTrees machine learning algorithm being optimal.
Conclusion: The use of radiomics model based on renal CT images can be noninvasively used to predict the immune infiltration level of ccRCC as well as combined with clinical information to create columnar plots predicting total survival in people with ccRCC and to predict responsiveness to ICI therapy, findings that may be useful in stratifying the prognosis of patients with ccRCC and guiding clinical practitioners to develop individualized regimens in the treatment of their patients.
Keywords: Clear cell renal cell carcinoma; Immune checkpoint inhibitors; Machine learning; Prognosis; Radiomics; Tumour immune infiltration.
© 2025. The Author(s).
Conflict of interest statement
Declarations. Ethical approval: All datasets in this study were downloaded from public databases, including the TCGA ( https://www.cancer.gov/ccg/research/genome-sequencing/tcga ) and TCIA ( https://www.cancerimagingarchive.net/ ) databases. These public databases allow researchers to download and analyse public datasets for scientific purposes. Consent for publication: Not applicable. Competing interests: The authors declare no competing interests.
Figures


Similar articles
-
[Predictive value of CT-based tumor and peritumoral radiomics for WHO/ISUP grading of non-metastatic clear cell renal cell carcinoma].Zhonghua Yi Xue Za Zhi. 2025 Jul 15;105(26):2195-2202. doi: 10.3760/cma.j.cn112137-20250226-00460. Zhonghua Yi Xue Za Zhi. 2025. PMID: 40660974 Chinese.
-
Preoperative prediction of renal fibrous capsule invasion in clear cell renal cell carcinoma using CT-based radiomics model.Br J Radiol. 2024 Sep 1;97(1161):1557-1567. doi: 10.1093/bjr/tqae122. Br J Radiol. 2024. PMID: 38897659 Free PMC article.
-
Bi-Regional Machine Learning Radiomics Based on CT Noninvasively Predicts LOX Expression Level and Overall Survival in Hepatocellular Carcinoma.Cancer Med. 2025 Aug;14(15):e71154. doi: 10.1002/cam4.71154. Cancer Med. 2025. PMID: 40792413 Free PMC article.
-
Cost-effectiveness of using prognostic information to select women with breast cancer for adjuvant systemic therapy.Health Technol Assess. 2006 Sep;10(34):iii-iv, ix-xi, 1-204. doi: 10.3310/hta10340. Health Technol Assess. 2006. PMID: 16959170
-
The Machine Learning Models in Major Cardiovascular Adverse Events Prediction Based on Coronary Computed Tomography Angiography: Systematic Review.J Med Internet Res. 2025 Jun 13;27:e68872. doi: 10.2196/68872. J Med Internet Res. 2025. PMID: 40513092 Free PMC article.
References
-
- Bukavina L, Bensalah K, Bray F, Carlo M, Challacombe B, Karam JA, Kassouf W, Mitchell T, Montironi R, O’Brien T, et al. Epidemiology of renal cell carcinoma: 2022 update. Eur Urol. 2022;82:529–42. 10.1016/j.eururo.2022.08.019. - PubMed
-
- Miller KD, Goding Sauer A, Ortiz AP, Fedewa SA, Pinheiro PS, Tortolero-Luna G, Martinez-Tyson D, Jemal A, Siegel RL. Cancer statistics for Hispanics/Latinos, 2018. CA Cancer J Clin. 2018;68:425–45. 10.3322/caac.21494. - PubMed
-
- Ferlay J, Colombet M, Soerjomataram I, Dyba T, Randi G, Bettio M, Gavin A, Visser O, Bray F. Cancer incidence and mortality patterns in Europe: estimates for 40 countries and 25 major cancers in 2018. Eur J Cancer. 2018;103:356–87. 10.1016/j.ejca.2018.07.005. - PubMed
-
- Arai T, Sazuka T, Sato H, Kato M, Kamada S, Katsura S, Seito A, Miyamoto S, Wakai K, Takeuchi N, et al. A clinical investigation of recurrence and lost follow-up after renal cell carcinoma surgery: a single-center, long-term, large cohort, retrospective study. Int J Clin Oncol. 2022;27:1467–76. 10.1007/s10147-022-02204-x. - PubMed
-
- Marconi L, Dabestani S, Lam TB, Hofmann F, Stewart F, Norrie J, Bex A, Bensalah K, Canfield SE, Hora M, et al. Systematic review and Meta-analysis of diagnostic accuracy of percutaneous renal tumour biopsy. Eur Urol. 2016;69:660–73. 10.1016/j.eururo.2015.07.072. - PubMed
MeSH terms
LinkOut - more resources
Full Text Sources
Medical
