

Body mass index and all-cause mortality in US stroke population: a cohort study
- PMID: 40596975
- PMCID: PMC12210508
- DOI: 10.1186/s12883-025-04277-3
Body mass index and all-cause mortality in US stroke population: a cohort study
Abstract
Background: Obesity and overweight are major global health concerns, associated with increased rates of stroke and mortality. This study sought to investigate the relationship between BMI and all-cause mortality among stroke patients in the United States.
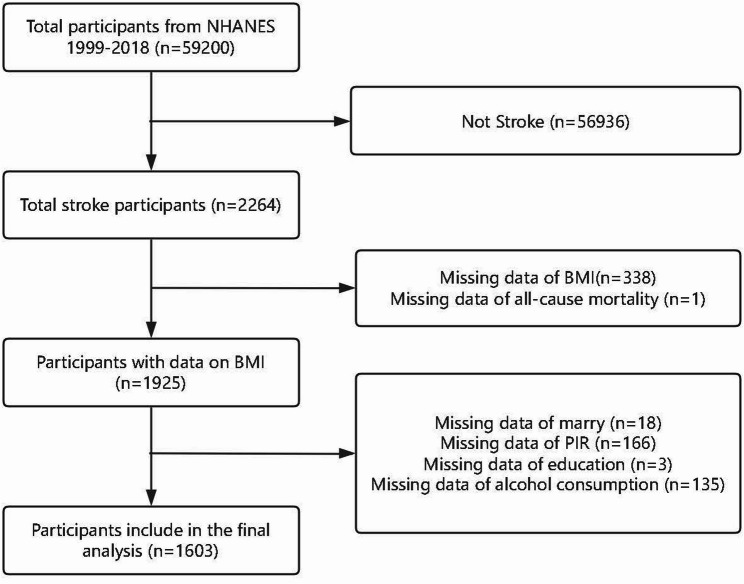
Methods: This study utilized data from 1,603 stroke survivors from the National Health and Nutrition Examination Survey (NHANES) cycles (1999-2018) linked to the National Death Index. BMI was calculated and grouped into normal weight (BMI < 25 kg/m²), overweight (25 ≤ BMI < 30 kg/m²), or obese (BMI ≥ 30 kg/m²).
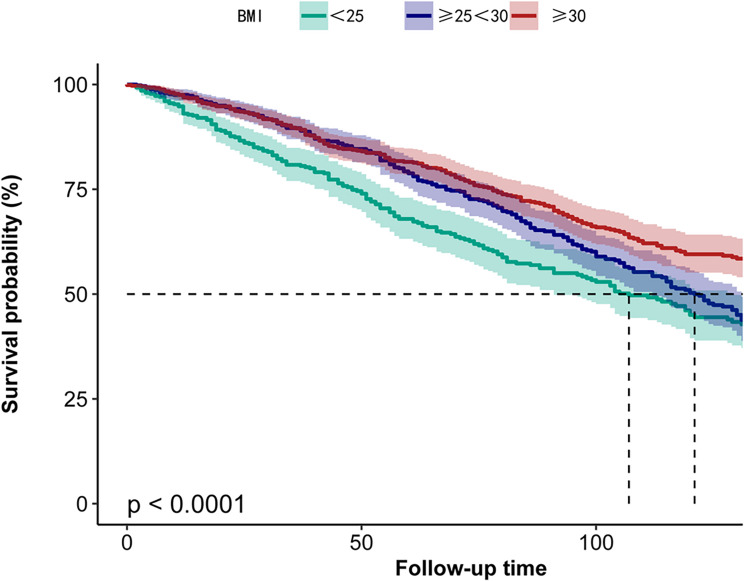
Results: Higher BMI was inversely related to all-cause mortality and therefore associated with lower mortality in overweight and obese patients than in individuals with normal weight (HR for 25 ≤ BMI < 30 kg/m2: 0.71 [95% CI: 0.58-0.86], p0.001; HR for BMI ≥ 30 kg/m2: 0.75 [95% CI: 0.61-0.91], p = 0.004). Subgroup analysis found stronger negative correlations between participants aged 60 years, women, non-Hispanic whites, and non-Hispanic blacks. A gender interaction was observed, suggesting varying effects of BMI on survival between males and females. The restricted cubic spline model indicated a non-linear relationship, with an inflection point at a BMI of 30.26 kg/m². Below this threshold, BMI was inversely linked to mortality, while above it, the association leveled off.
Conclusions: Stroke survivors with elevated BMI, particularly those categorized as overweight or obese, exhibit reduced all-cause mortality in comparison to individuals with normal or low BMI. Further investigation is necessary to clarify this paradox's mechanisms and improve clinical recommendations.
Keywords: All-cause mortality; Body mass index; Cohort study; National health and nutrition examination survey; Stroke.
© 2025. The Author(s).
Conflict of interest statement
Declarations. Ethics approval and consent to participate: The NHANES obtained approval from the NCHS Ethics Review Committee. Before enrollment, participants gave written informed consent. For secondary analysis, no further institutional review board approval was necessary. This study was also approved by our institutional ethical committee. Consent for publication: Not applicable. Competing interests: The authors declare no competing interests. Clinical trial number: Not applicable. Disclaimer: The opinions presented in this article are the sole responsibility of the authors and may not align with the perspectives, choices, or regulations of their respective institutions.
Figures


References
MeSH terms
LinkOut - more resources
Full Text Sources
Medical
