Bioinformatics identification and validation of m6A/m1A/m5C/m7G/ac4 C-modified genes in oral squamous cell carcinoma
- PMID: 40597017
- PMCID: PMC12211329
- DOI: 10.1186/s12885-025-14216-7
Bioinformatics identification and validation of m6A/m1A/m5C/m7G/ac4 C-modified genes in oral squamous cell carcinoma
Abstract
Background: RNA modifications, including m6A, m1A, m5C, m7G, and ac4C, may play a role in the occurrence and development of cancer, such as proliferation. However, the effects of RNA modification-related genes (RRGs) in the development of oral squamous cell carcinoma (OSCC) have not been fully elucidated. The present study aimed to evaluate the effects and mechanisms of RRGs on OSCC development progression.
Methods: RNA-seq transcriptome data, along with clinical and prognostic information, were extracted for 328 patients with OSCC from the TCGA database. A total of 49 RRGs were analyzed for differential expression. We then performed Lasso analysis, as well as univariate and multivariate Cox regression analyses, followed by Kaplan-Meier survival analysis to identify relevant prognostic genes and establish a risk-prognosis model. Patients were categorized into high-risk and low-risk groups, and gene set enrichment analysis (GSEA) was conducted to analyze differences in gene signatures between these two groups, using data from the Kyoto Encyclopedia of Genes and Genomes (KEGG) and Gene Ontology (GO) databases. RT-PCR was employed to validate the expression levels of differentially expressed genes in OSCC samples. The four most significantly differentially expressed genes were selected for further functional analysis, and small interfering RNA (siRNA) vectors targeting these genes were transfected into OSCC CAL27 cells. The Cell Counting Kit-8 (CCK-8) assay was used to evaluate cell proliferation. Additionally, a subcutaneous CAL27 xenograft model transfected with short hairpin RNA (shRNA), combined with Ki-67 immunohistochemical (IHC) staining and TUNEL assay, was used to investigate their underlying molecular mechanisms in vivo.
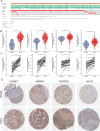
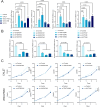
Results: Among the 49 RRGs, four genes (IGF2BP2, HNRNPC, NAT10, and TRMT61B) were found to be associated with the development of OSCC. Based on various methodological validations, a risk score model was constructed using these four genes. The high-risk and low-risk groups of OSCC patients exhibited significantly different survival outcomes and clinicopathological characteristics. Patients in the low-risk group had longer overall survival (OS) and lower mortality rates compared to those in the high-risk group. The nomogram and decision curve analysis (DCA) demonstrated that our risk model accurately and reliably predicted the impact of risk factors on OS at 1-, 3-, and 5-year. Additionally, risk scores correlated with the infiltration of several immune cells, particularly CD8+ T cells and B cells, which showed significant negative correlations. Furthermore, the results of the CCK-8 assay indicated that inhibition of NAT10 and IGF2BP2 expression using siRNA inhibited the proliferation of OSCC cell lines in vitro. Meanwhile, inhibition of NAT10 and IGF2BP2 expression using shRNA influenced proliferation of tumorigenicity in vivo.
Conclusion: In this study, we established a risk model and nomogram based on four RRGs, which can be used for risk stratification and predicting survival outcomes in patients with OSCC. This provides a reliable reference for individualized therapy in OSCC patients.
Keywords: Bioinformatics analysis; Biomarkers; Oral squamous cell carcinoma; Prognostic signature; RNA modification.
© 2025. The Author(s).
Conflict of interest statement
Declarations. Ethics approval and consent to participate: The study protocol was reviewed and approved by the Ethics Committee of Xinhua Hospital Affiliated to Shanghai Jiao Tong University School of Medicine (No. XHEC-D-2022-244). The animal experiments involved in this paper were approved by the animal care facility and Animal Ethics Committee of Shanghai Ninth People's Hospital (No. SH9H-2024-A1118-SB). Consent for publication: Not applicable. Competing interests: The authors declare no competing interests.
Figures


References
-
- Binmadi NO, Basile JR. Perineural invasion in oral squamous cell carcinoma: a discussion of significance and review of the literature. Oral Oncol. 2011;47(11):1005–10. - PubMed
-
- Chow LQ. Head and Neck Cancer. N Engl J Med. 2020;382(1):60–72. - PubMed
-
- Jemal A, Bray F, Center MM, Ferlay J, Ward E, Forman D. Global cancer statistics. CA Cancer J Clin. 2011;61(2):69–90. - PubMed
MeSH terms
Substances
Grants and funding
- XKPF2024B500/Construction Project of the "Discipline Peak-Climbing Plan" of Xinhua Hospital Affiliated to Shanghai Jiao Tong University School of Medicine
- XKPF2024B500/Construction Project of the "Discipline Peak-Climbing Plan" of Xinhua Hospital Affiliated to Shanghai Jiao Tong University School of Medicine
- YG2022QN053/Interdisciplinary Program of Shanghai Jiao Tong University
- 82072892/National Natural Science Foundation of China
- 82072892/National Natural Science Foundation of China
- 82072892/National Natural Science Foundation of China
- 2023GXNSFAA026276/Natural Science Foundation of Guangxi Zhuang Autonomous Region
- 2023GXNSFAA026276/Natural Science Foundation of Guangxi Zhuang Autonomous Region
- 2023GXNSFAA026276/Natural Science Foundation of Guangxi Zhuang Autonomous Region
- XK202405/Key Discipline Construction project of Jiading District Health System
- XK202405/Key Discipline Construction project of Jiading District Health System
- XK202405/Key Discipline Construction project of Jiading District Health System
LinkOut - more resources
Full Text Sources
Medical
Research Materials

