

Diversity and equity in medical education over the past decade: applications, matriculations, and the growing gaps
- PMID: 40597029
- PMCID: PMC12211177
- DOI: 10.1186/s12909-025-07498-9
Diversity and equity in medical education over the past decade: applications, matriculations, and the growing gaps
Abstract
Background: Diversity and race-concordant relationships contribute to improved patient experiences and outcomes. In contrast, the representation of underrepresented in medicine (URiM) individuals in different medical specialties is declining. The essential pathway to improving diversity within the future workforce centers around the inclusion of a diverse cohort of medical students. We aimed to examine the diversity of medical school applications and admissions across sex, race and ethnicity over the past decade.
Methods: This study used data from the Association of American Medical Colleges from 2015 to 2024. URiM individuals refer to minority populations that are underrepresented in the medical profession, including Black, Hispanic, American Indian or Alaska Native (AIAN), and Native Hawaiian or Other Pacific Islander (NHPI). Diversity representation was measured using the representation index.
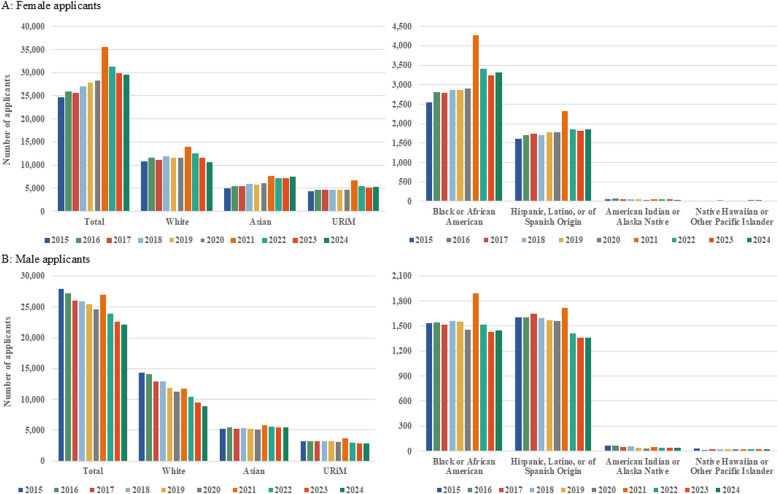
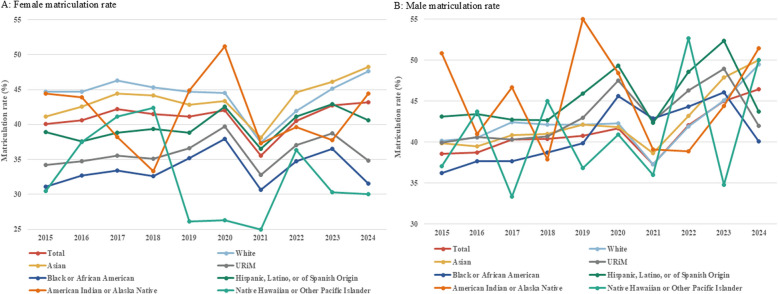
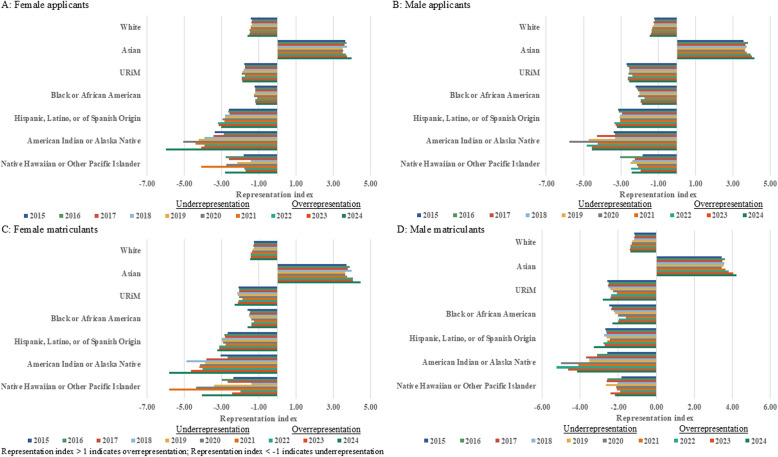
Results: There was an increasing trend in medical school applicants among females but a decreasing trend among males. The number of Asian female applicants increased significantly (51.33%), while the numbers of Black (29.74%) and Hispanic (14.98%) female applicants also showed notable upward trends. Matriculation rates for Black females (mean: 33.64%; SD: 2.28%) and overall URiM females (mean: 35.94%; SD: 2.02%) have consistently remained below White females (mean: 44.22%; SD: 2.66%), Asian females (mean: 43.57%; SD: 2.59%), and the national average for females (mean: 40.96%; SD: 2.05%) over the past decade. The findings indicate that all racial and ethnic groups were underrepresented among both applicants and matriculants over the last decade, with the exception of Asian individuals. The representation index between matriculants and applicants among Black females (-1.46 vs. -1.19; P < 0.001) is widening, which may help explain the underrepresentation discrepancy for overall URiM females (-2.09 vs. -1.83; P < 0.001).
Conclusion: This study highlights both progress and persistent challenges in achieving racial and ethnic diversity in U.S. medical education. While female and URiM applicant numbers have increased, matriculation disparities remain, especially among Black and URiM females. The widening representation gap between applicants and matriculants underscores structural barriers that continue to hinder equity in medical school admissions. A more inclusive physician workforce should begin with meaningful reform in how future doctors are recruited, supported, and selected.
Keywords: Disparity; Diversity; Matriculation; Medical school applications and admissions.
© 2025. The Author(s).
Conflict of interest statement
Declarations. Ethics approval and consent to participate: The University of Tennessee Health Science Center institutional review board reviewed the study protocol and granted an exemption from full review. Informed patient consent was also waived because the study was a secondary analysis of deidentified data. Consent for publication: Not applicable. Competing interests: The authors declare no competing interests.
Figures
Similar articles
-
Community Racial and Ethnic Representation Among Physicians in US Internal Medicine Residency Programs.JAMA Netw Open. 2025 Jan 2;8(1):e2457310. doi: 10.1001/jamanetworkopen.2024.57310. JAMA Netw Open. 2025. PMID: 39883461 Free PMC article.
-
The relationship between required physician letters of recommendation and decreasing diversity in osteopathic medical school admissions.J Osteopath Med. 2023 Mar 21;123(6):287-293. doi: 10.1515/jom-2022-0112. eCollection 2023 Jun 1. J Osteopath Med. 2023. PMID: 37012063
-
Underrepresentation of Black Men in Physician Assistant and Associate Training.JAMA Netw Open. 2024 Oct 1;7(10):e2441531. doi: 10.1001/jamanetworkopen.2024.41531. JAMA Netw Open. 2024. PMID: 39466242 Free PMC article.
-
Academic surgery: Faculty gender and racial trends through an intersectional lens.Women Health. 2025 Jul;65(6):533-544. doi: 10.1080/03630242.2025.2523256. Epub 2025 Jul 4. Women Health. 2025. PMID: 40616286 Review.
-
Dissecting Diversity: A Comprehensive Look at the Present Landscape and Future Challenges in Surgical Specialties.J Surg Educ. 2024 Jul;81(7):1004-1011. doi: 10.1016/j.jsurg.2024.04.003. Epub 2024 May 17. J Surg Educ. 2024. PMID: 38760190 Review.
References
-
- Unique Populations. Association of American Medical Colleges (AAMC). Accessed April 11, 2025. https://www.aamc.org/career-development/affinity-groups/gfa/unique-popul...
-
- Page S. The Difference -- a book by Scott Page. Accessed April 11, 2025. https://www.stevedenning.com/radical-management/the-difference-by-scott-...
-
- Diversity in Medicine: Facts and Figures 2019.https://www.aamc.org/data-reports/workforce/report/diversity-medicine-fa...
MeSH terms
LinkOut - more resources
Full Text Sources
Miscellaneous
