. 2025 Jul 1;23(1):321.
doi: 10.1186/s12964-025-02315-8.

Senescence-associated alterations in histone H3 modifications, HP1 alpha levels and distribution, and in the transcriptome of vascular smooth muscle cells in different types of senescence

Affiliations

Senescence-associated alterations in histone H3 modifications, HP1 alpha levels and distribution, and in the transcriptome of vascular smooth muscle cells in different types of senescence

Agnieszka Gadecka et al. Cell Commun Signal. .

Abstract

Background: Cellular senescence is a fundamental process leading to organismal aging and age-related diseases. Alterations accompanying cellular senescence concern, among others, nucleus architecture, chromatin structure, DNA damage and gene expression. Some changes are universal for all types of senescence, but some characteristics are typical for a given senescence inductor or cell type. The aim of the study was to analyze senescence-associated alterations in chromatin modifications and look for differences depending on senescence type (replicative, RS and stress-induced premature senescence, SIPS) in vascular smooth muscle cells (VSMCs) in vitro. The alterations were compared with those observed in VSMCs derived from atherosclerotic plaques (ex vivo) and, to assess their universality, with those in senescent fibroblasts.

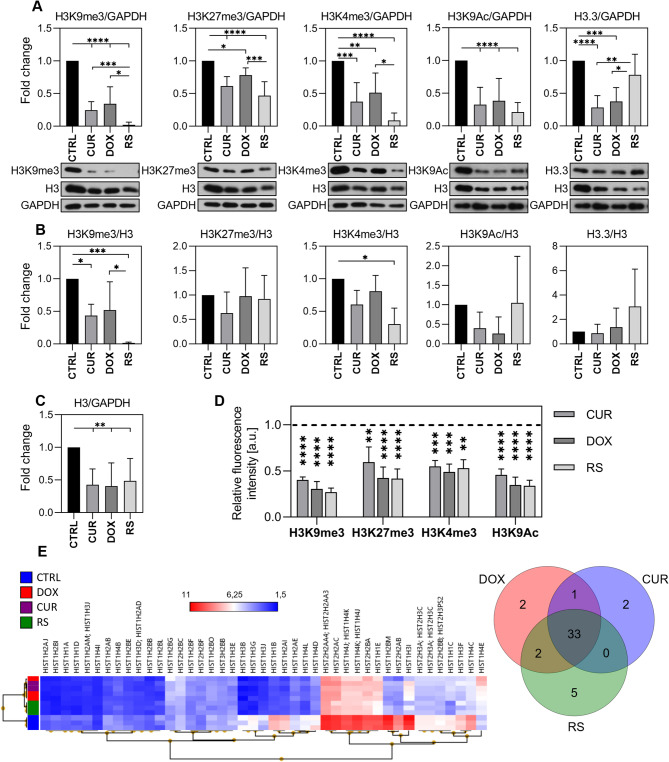
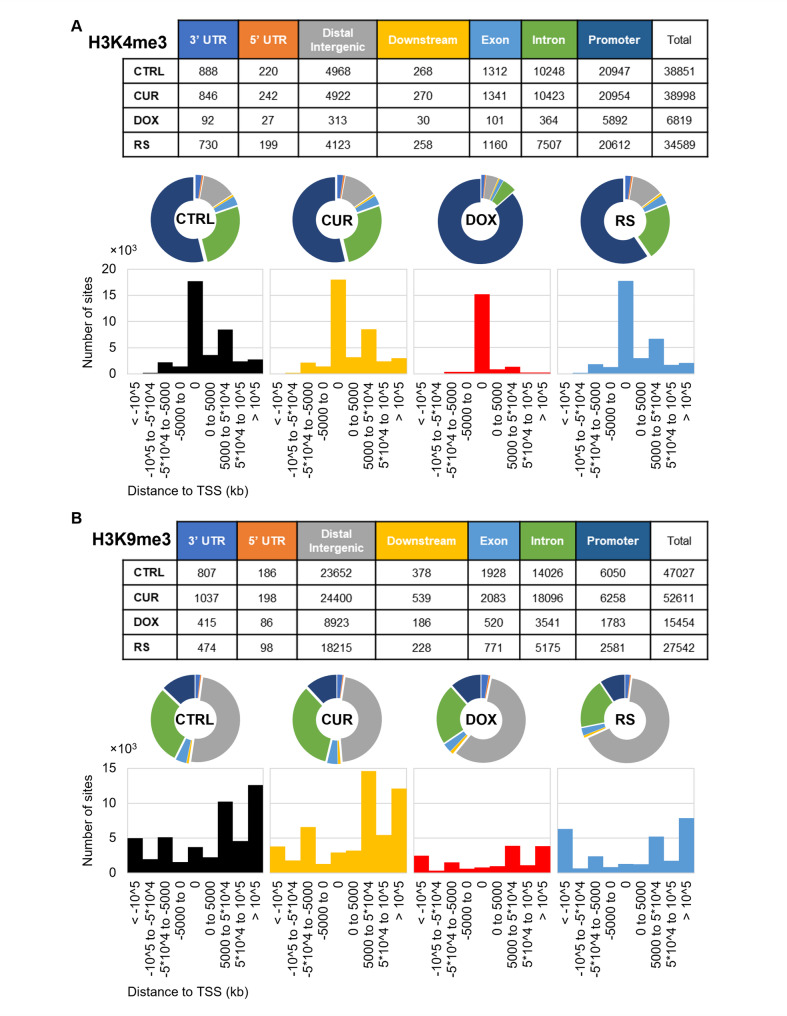
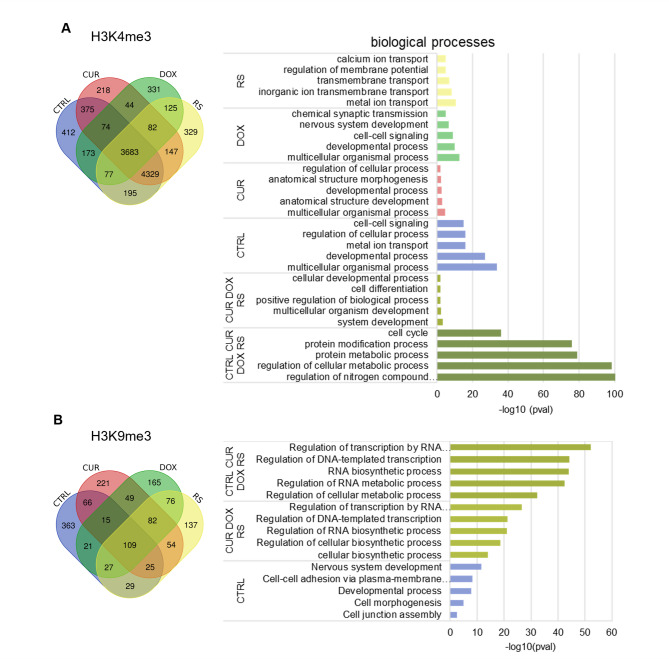
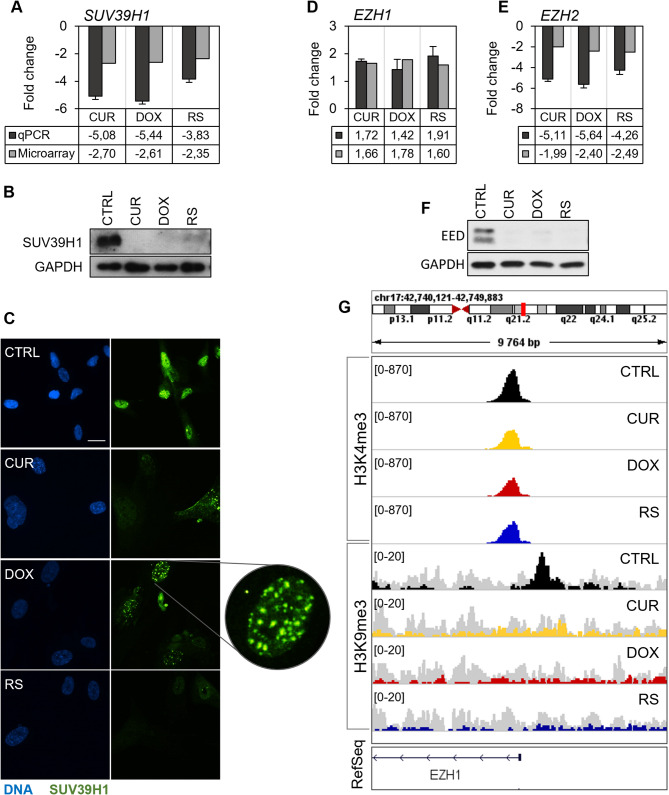
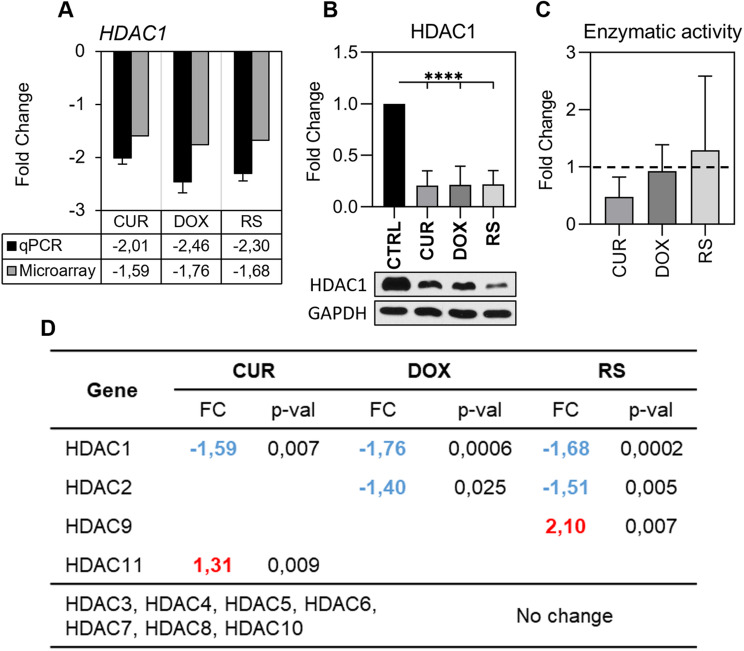
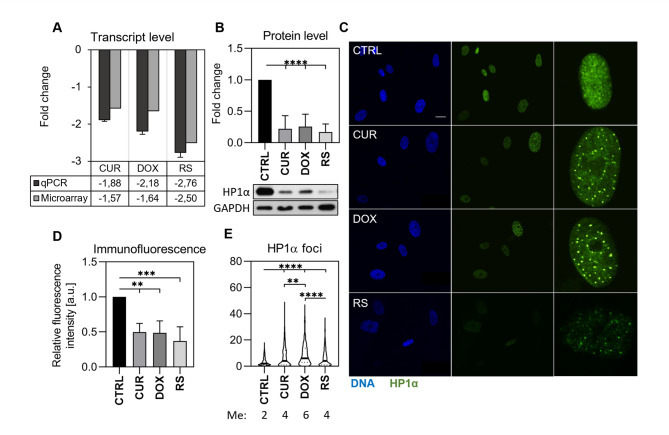
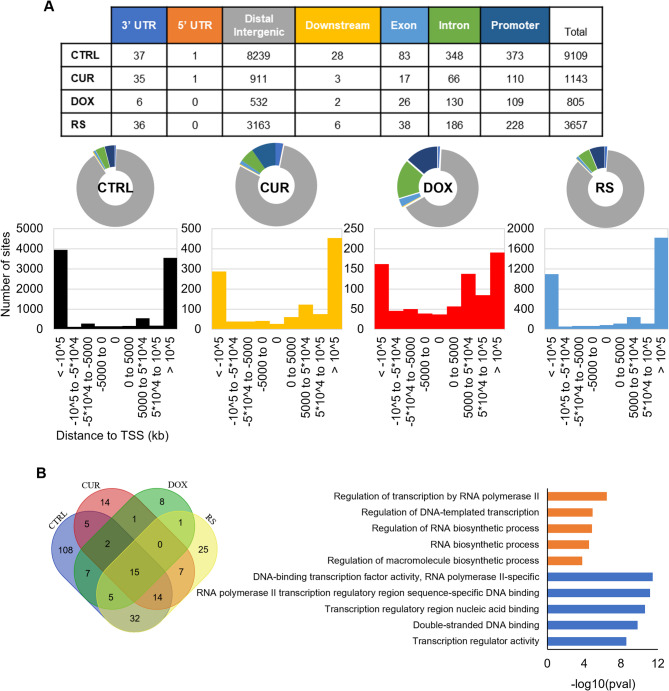
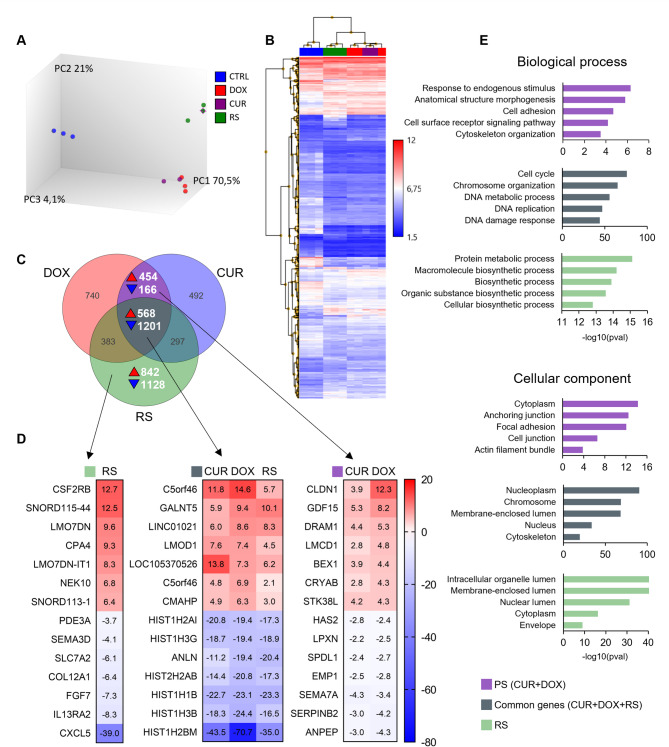
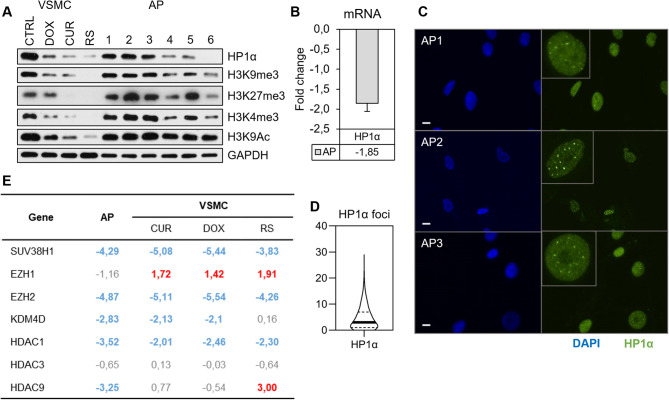
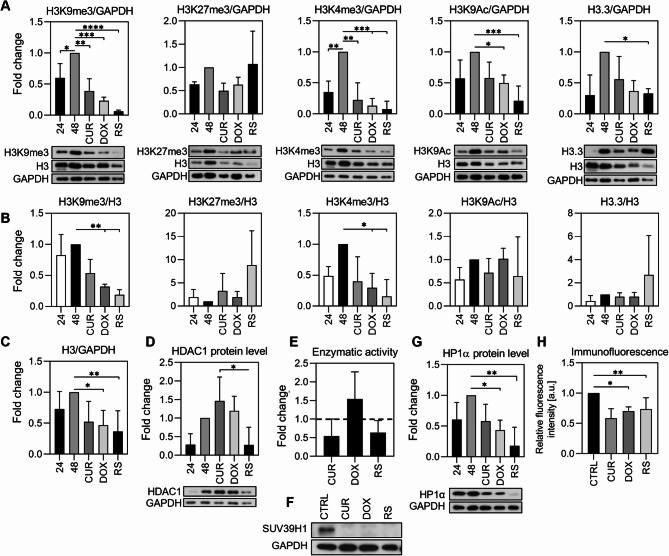
Methods: We investigated the level and distribution of HP1α and H3 modifications that are markers of hetero- and euchromatin (H3K9me3, H3K27me3, H3K4me3, H3K9Ac - WB and IF), alterations in the transcriptomic profile (DNA microarray, qPCR), H3K4me3, H3K9me3 and HP1α protein distribution in the genome (ChIP-seq), and expression of enzymes involved in histone post-translational modifications (DNA microarray, qPCR, WB, IF).

Results: Our results have shown that the decline in H3K4me3 and H3K9me3 modifications and in HP1α is a universal hallmark of senescence in all tested cell and senescence types, although the extent of the change depends on the senescence inductor. The distribution of H3K4me3 and H3K9me3 in the genome of VSMCs depends on the senescence type, and the transcriptomic analysis identified genes and processes specific to each type.

Conclusions: We characterized senescence and cell type-dependent changes in chromatin-associated proteins and enzymes involved in histone H3 decoration which, in consequence, impact senescence-associated gene expression. We can conclude that certain similar alterations occur in senescent VSMCs ex vivo, although inter-individual differences usually obscure them. Our results clearly showed that differences existed not only between young and senescent cells but also between SIPS and RS ones. The subtle differences between various SIPS types suggest that various stressors activate the same cellular mechanisms. This study can serve as a starting point to search for factors that may be used to distinguish between SIPS and RS, which in turn could be helpful in defining conditions responsible for accelerated aging.

Keywords: Chromatin structure; HP1α; Histone H3 modifications; Senescence; VSMCs.


Conflict of interest statement

Declarations. Ethical approval: Research involving human biological material - smooth muscle cells isolated from atherosclerotic plaque were obtained from patients who underwent carotid endarterectomies. Studies with human samples were approved by the Ethical Committee of the Central Clinical Hospital Ministry of Internal Affairs (2017/114). Written informed consent was obtained from all patients. Consent for publication: Not applicable. Competing interests: The authors declare no competing interests.

Figures

Fig. 1
Fig. 1
Alterations in the level of histone H3 modifications and nucleosome composition in premature (CUR, DOX) and replicative senescence (RS). (A) The protein levels of selected heterochromatin (H3K9me3, H3K27me3) and euchromatin (H3K4me3, H3K9Ac) markers and H3.3 were analyzed by Western blotting and protein expression data was normalized to GAPDH or (B) to H3. (C) total histone H3 were analyzed by Western blotting and normalized to GAPDH. (D) Immunofluorescence staining expressed as relative fluorescence intensity. (E) Changes in transcript level of various histone variants was analyzed with microarrays where the Venn diagram on the left shows the number of histone genes per each group/treatment relative to control cells and the heatmap shows hierarchical clustering of genes encoding clusters of histone variants as signal changes (log2). The mean fluorescence signal was recorded for cells based on their nuclear surface area (for young cells < 200 µm2, for senescent cells > 200 µm2) (D). Densitometric data and mean fluorescence intensity signal detection were calculated as a mean ± SD from three independent experiments in cells isolated from at least three donors (n ≥ 3) (A, B, C). Results are presented as a relative fold change compared to control cells. The dashed line represents control cells (D). Venn diagram and heatmap were prepared using TAC software. Statistical analysis was performed using one-way ANOVA between all experimental variants: p < 0,05 (*), p < 0,01 (**), p < 0,001 (***), p < 0,0001 (****)
Fig. 2
Fig. 2
Distribution of H3K4me3 (A) and H3K9me3 (B) in the genome of young and senescent VSMCs. Tables summarize the enrichment of H3K4me3 and H3K9me3 in given areas of the genome for each experimental variant. Pie charts show the percentage amount of a given modification in each area, and the bar charts below show the distribution of enrichment sites around the transcription start site (TSS). The following labels were used: black - CTRL, yellow - CUR, red - DOX, blue – RS and colors in the table correspond to colors applied for pie charts
Fig. 3
Fig. 3
Functional analysis of H3K4me3 (A) and H3K9me3 (B) enrichment in biological processes. The Venn diagram shows intersections of differentially expressed genes for all experimental variants, and the bar charts show biological processes in which the transcriptionally active (enrichment in H3K4me3) or silenced (enrichment in H3K9me3) genes are involved. Gene sets were analyzed using g: Profiler and Gene Ontology database
Fig. 4
Fig. 4
Analysis of selected methyltransferases in different types of senescence in VSMCs. (A) Changes in SUV39H1 mRNA level were measured with qPCR (black) and microarrays (gray). Data are presented as a mean ± SD fold change relative to control (n = 3). (B) Protein level of SUV39H1 analyzed by Western blot. Representative image from 3 independent experiments. (C) Reorganization of SUV39H1 protein in the nucleus visualized by immunocytochemical staining. 10 μm scale; (D, E) Gene expression profile of EZH1 and EZH2, respectively. (F) Protein EED expression was evaluated by Western blotting. Representative images from 3 independent experiments. (G) Visual representation of enrichment profile of H3K4me3 and H3K9me3 in the gene EZH1 promoter region generated in IGV. Color scheme: black – control, yellow – curcumin-treated cells, red – doxorubicin-treated cells, blue – replicative senescence, gray – input signal
Fig. 5
Fig. 5
Analysis of selected histone deacetylases mRNAs, protein levels and activity in senescent cells. (A) Changes in HDAC1 mRNA level were measured using microarray (gray) and qPCR (black). (B) HDAC1 protein levels were determined by Western blotting. Densitometry results were prepared from three replicates, and a representative image is shown. Statistical analysis was performed using one-way ANOVA: p < 0.0001 (****). (C) Changes in enzymatic activity of a set of deacetylases (HDAC1, HDAC2, HDAC3, HDAC6, HDAC8, HDAC10 and HDAC11). (D) List of genes encoding histone deacetylases and the direction of changes observed during senescence (based on microarrays). The mRNA level is marked as the relative fold change in expression (FC) with the direction of change marked in color. Red indicates an increase and blue a decrease
Fig. 6
Fig. 6
Changes in HP1α gene and protein expression accompanying different types of senescence. (A) mRNA level was determined by microarray (gray) and qPCR (black). (B) Densitometry results and representative images were obtained by Western blotting (n = 3). (C) Representative images of HP1α distribution in the nucleus (n = 3). Scale 10 μm. The far-right pictures show a zoom-in image of selected nuclei (D) Changes in the mean intensity of HP1α immunofluorescence staining in the nucleus (n = 3). (E) Graph showing the distribution of protein clusters (n = 4). The middle line marks the median, the exact value of which is given below the graph (Me). The dashed line marks the interquartile range. Statistical analysis was performed using one-way ANOVA: p < 0,05 (*), p < 0,01 (**), p < 0,001 (***), p < 0,0001 (****)
Fig. 7
Fig. 7
Distribution of HP1α in the genome of young and senescent VSMCs and functional analysis of sites of HP1α and H3K9me3 co-occurrence. (A) Table summarizing enrichment of HP1α in given areas of the genome for each experimental variant. The middle graphs show the percentage of reads of each area of the genome, and the panel below shows the distribution of enrichment sites around the transcription start site (TSS). The following labels were used: black - CTRL, yellow - CUR, red - DOX, blue – RS. (B) Venn diagram delineating intersecting sets containing common areas of enrichment of both HP1α and H3K9me3. The graph on the right shows functional analysis of the indicated HP1α and H3K9me3 co-occurrence sites characteristic only of young cells. The diagram lists terms for biological processes (orange) and molecular functions (blue). A detailed list of genes from all intersections is presented in Additional file 7
Fig. 8
Fig. 8
Summary of changes in transcriptomic profile in young and senescent cells. (A) Principal component (PC) analysis shows differences between RS (green dots) and PS (DOX cells - red, CUR cells - purple) and between the two types of senescent cells and young cells (blue dots). Image prepared with TAC software. (B) DEG hierarchical clustering with log2 heat map of the signal recorded for each gene. Image prepared with TAC software. (C) Venn diagram showing the intersections of DEGs in each experimental variant relative to young cells, including the number of genes in each subset. For each type of senescent cells: PS (DOX and CUR), RS, and PS + RS the number of genes with increased (red triangle) and decreased (blue triangle) expression is indicated. (D) A list of the 7 most upregulated and the 7 most downregulated genes in each set (PS - DOX and CUR, RS and common for PS and RS). On the right is a heat map showing Fold Change. (E) Functional analysis of genes specific to the studied compartments (PS, RS and common for PS and RS). The graphs show biological processes and include the location in the cell where the gene product has a specific function (cellular component). The analysis was performed using the g: Profiler tool, which relied on the Gene Ontology database. List of genes characteristic exclusively for senescence induced by DOX or CUR is presented in Additional file 8
Fig. 9
Fig. 9
Changes in the level and localization of histone modifications, HP1α and expression of histone-modifying enzymes in cells derived from atherosclerotic plaques (AP). (A) Examples of changes in the level of HP1α, H3K9me3, H3K27me3 (heterochromatin markers) and H3K4me3 and H3K9Ac (euchromatin markers) obtained by Western blotting from cells derived from 6 donors (right side of the blot) compared to VSMCs in vitro (left side of the blot). (B) HP1α mRNA level measured by qPCR and presented as a fold change relative to young VSMCs from in vitro culture, n = 3 (C) Representative pictures of HP1α analyzed by immunofluorescence of cells derived from three donors; 10 μm scale (D) Graph showing the HP1α foci number in AP cells from 3 donors. The middle line marks the median, the exact value of which is marked on the graph (Me = 4). The dashed line marks the interquartile range. (E) The Expression of histone modification enzymes was analyzed by qPCR and compared to that of VSMCs in vitro
Fig. 10
Fig. 10
Changes in the levels of histone H3, its variant H3.3, histone H3 modifications, HP1α and enzymes responsible for histone H3 modifications in young and senescent fibroblasts. (A) Changes in histone modifications (H3K9me3, H3K27me3, H3K4me3, H3K9Ac) and H3.3 variant normalized to GAPDH. (B) and to H3. (C) Changes in H3 protein level normalized to GAPDH. D Changes in HDAC1 protein level. (E) Enzymatic activity of histone deacetylases (HDAC1, HDAC2, HDAC3, HDAC6, HDAC8, HDAC10 and HDAC11) relative to control (dashed line). (F) Changes in SUV39H1 protein level. (G) Analysis of HP1α protein level in fibroblasts measured by Western blotting. (H) Measurement of HP1α fluorescence intensity. All assays were performed in 3 biological replicates and in most cases presented as mean ± SD. A - D, F, G - densitometric analysis and representative image from Western blotting. Proteins were normalized do GAPDH or H3 and presented as fold change relative to young, 48 h control cells. Statistical analysis was performed relative to 48 h control using one-way ANOVA: p < 0.05 (*), p < 0.01 (**), p < 0.001 (***), p < 0.0001 (****)

Similar articles

References

    1. Baker DJ, Wijshake T, Tchkonia T, LeBrasseur NK, Childs BG, van de Sluis B, et al. Clearance of p16Ink4a-positive senescent cells delays ageing-associated disorders. Nature. 2011;479:7372:232–6. - PMC - PubMed
    1. Baker DJ, Childs BG, Durik M, Wijers ME, Sieben CJ, Zhong J, et al. Naturally occurring p16(Ink4a)-positive cells shorten healthy lifespan. Nature. 2016;530:7589: 184–9. - PMC - PubMed
    1. Childs BG, Baker DJ, Wijshake T, Conover CA, Campisi J, van Deursen JM. Senescent intimal foam cells are deleterious at all stages of atherosclerosis. Science. 2016;354(6311):472–7. - PMC - PubMed
    1. López-Otín C, Blasco MA, Partridge L, Serrano M, Kroemer G. Hallmarks of aging: an expanding universe. Cell. 2023;186(2):243–78. - PubMed
    1. Hiragami-Hamada K, Soeroes S, Nikolov M, Wilkins B, Kreuz S, Chen C, et al. Dynamic and flexible H3K9me3 bridging via HP1β dimerization establishes a plastic state of condensed chromatin. Nat Commun. 2016;19:711310. - PMC - PubMed

MeSH terms

LinkOut - more resources