. 2025 Jul 1;17(1):72.
doi: 10.1186/s13073-025-01494-w.

Clinical applications of and molecular insights from RNA sequencing in a rare disease cohort

Affiliations

Clinical applications of and molecular insights from RNA sequencing in a rare disease cohort

Jamie C Stark et al. Genome Med. .

Abstract

Background: RNA sequencing (RNA-seq) is emerging as a valuable tool for identifying disease-causing RNA transcript aberrations that cannot be identified by DNA-based testing alone. Previous studies demonstrated some success in utilizing RNA-seq as a first-line test for rare inborn genetic conditions. However, DNA-based testing (increasingly, whole genome sequencing) remains the standard initial testing approach in clinical practice. The indications for RNA-seq after a patient has undergone DNA-based sequencing remain poorly defined, which hinders broad implementation and funding/reimbursement.

Methods: In this study, we identified four specific and familiar clinical scenarios, and investigated in each the diagnostic utility of RNA-seq on clinically accessible tissues: (i) clarifying the impact of putative intronic or exonic splice variants (outside of the canonical splice sites), (ii) evaluating canonical splice site variants in patients with atypical phenotypes, (iii) defining the impact of an intragenic copy number variation on gene expression, and (iv) assessing variants within regulatory elements and genic untranslated regions.

Results: These hypothesis-driven RNA-seq analyses confirmed a molecular diagnosis and pathomechanism for 45% of participants with a candidate variant, provided supportive evidence for a DNA finding for another 21%, and allowed us to exclude a candidate DNA variant for an additional 24%. We generated evidence that supports two novel Mendelian gene-disease associations (caused by variants in PPP1R2 and MED14) and several new disease mechanisms, including the following: (1) a splice isoform switch due to a non-coding variant in NFU1, (2) complete allele skew from a transcriptional start site variant in IDUA, and (3) evidence of a germline gene fusion of MAMLD1-BEND2. In contrast, RNA-seq in individuals with suspected rare inborn genetic conditions and negative whole genome sequencing yielded only a single new potential diagnostic finding.

Conclusions: In summary, RNA-seq had high diagnostic utility as an ancillary test across specific real-world clinical scenarios. The findings also underscore the ability of RNA-seq to reveal novel disease mechanisms relevant to diagnostics and treatment.

Keywords: Genetic disease; Molecular diagnostic techniques; Novel disease mechanisms; Pediatric rare disease; Putative (new) disease gene; RNA sequencing (RNA-seq); Splice variants; Transcriptomics; Variant of uncertain significance.


Conflict of interest statement

Declarations. Ethics approval and consent to participate: Participants were provided written informed consent under various research studies approved by the Research Ethics Board (REB) at The Hospital for Sick Children (SickKids), Toronto, Ontario, Canada. Written consent was obtained from each proband’s parents or guardians, with assent provided by the proband where appropriate. This consent included publication of de-identified clinical and research findings. The study was conducted in accordance with the Tri-Council Policy Statement: Ethical Conduct for Research Involving Humans (TCPS 2), Ontario’s Personal Health Information Protection Act (PHIPA), SickKids institutional research ethics guidelines and conformed to the principles of the Declaration of Helsinki. Competing interests: The authors declare no competing interests.

Figures

Fig. 1
Fig. 1
Cohort and study design. A Demographics of the rare diseasecohort. Pie charts depict proband phenotypic characteristics, level of prior genomic level testing (targeted only, whole exome sequencing only (WES) and/or whole genome sequencing ± other testing (WGS)), types of variants of interest identified on genomic sequencing, tissue samples used for both RNA-seq, and ACMG classification of candidate variants prior to RNA-seq analysis (P indicates pathogenic, LP indicates likely pathogenic and VUS indicates variant of unknown significance). Phenotypes N numbers are shown, where probands are divided based on multisystem or syndromic presentations characteristics, versus single-system presentations which are further divided based on the involved system. More detailed cohort summaries can be found in Additional file 3: Table S2. Complete phenotype information for each proband can be found in Additional file 4: Table S3. B Workflow for selecting tissues for RNA-seq in the presence or absence of a candidate DNA variant. When a candidate variant was identified on genomic sequencing, the GTEx portal [19] was used to determine the appropriate tissue types with baseline expression level of > 5 TPM for the gene of interest. If suitable banked tissue samples were available; they were used for the analysis. The tissue type used for RNA-seq is depicted for each proband based on the gene of interest. RNA-seq analysis focused on the candidate variant was performed initially, and if no pathogenic effect on the transcript was detected, cases were reflexed to hypothesis-independent RNA-seq analysis looking for any putative disease-causing RNA aberrations, when possible. For probands without candidate variants identified, banked tissue was used if available. Otherwise, tissue selection was determined based on expression levels of genes found on typical panels relevant to the proband’s phenotype. If no optimal sample was accessible, LCLs or blood was used. C RNA-seq analysis of candidate genomic variant outcome data coding methodology. RNA-seq results successfully enabling analysis of the relevant transcripts were classified as positive (variant affected the transcript) or negative (no difference from controls, meeting ACMG BS3 functional criteria). Positive results, if felt to be significant, were further categorized as “Diagnostic” (impact significantly deleterious, meeting PS3 ± PM1 functional criteria), “RNA VUS” (clinical impact uncertain, not clearly meeting PS3, PM1 or BS3 functional criteria). If a positive result’s, impact was not expected to be clinically significant (meeting BS3 functional criteria), they along with negative results refuted variant pathogenicity from a transcript-effect, and unless another mechanism (i.e., missense) was suspected (these were simply classified as “Transcript effect Ruled Out”), were considered “Diagnosis Ruled Out” cases. RNA-seq data for “Transcript effect Ruled Out,” “Diagnosis Ruled Out” and “RNA VUS” cases underwent analysis for any putative disease-causing RNA aberrations unrelated to the identified candidate, as did the “RNA VUS” cases. *Diagnostic or ruled out outcomes were deemed “diagnostically informative.” **RNA VUSs increased resolution on the candidate DNA variant
Fig. 2
Fig. 2
RNA-seq results for probands with candidate putative splicing variants. A Summary of positive RNA-seq results for putative splicing variants (depicted in red). Two candidate variants were synonymous, three were missense and fifteen were intronic. Diagnostic variant effects causing abnormal splicing are demonstrated in red, compared to normal splicing in black. In-frame exon skipping was seen in Case 1, out-of-frame exon skipping causing frameshift and premature stop codon was seen in Cases 10 and 52. Isoform switching to less biologically relevant transcripts was seen in Case 2. Exon extension was seen in Cases 8 and 12 and intron retention was seen in Case 51. In Case 9, several disrupted splice junctions were observed near the variant, causing near-complete allele-skew likely due to nonsense-mediated decay. B Case 1: Proband 1 Sagittal T1 and Axial T2 MRI Brain demonstrating severe microcephaly with abnormality of neuronal migration/organization, dysmorphic corpus callosum and brainstem, hypoplastic left olfactory bulb and right probable persistent hypertrophic primary vitreous and incidental pituitary cyst. C Case 1: Sashimi plot of SASS6 RNA-seq data in LCLs demonstrating mild in-frame skipping of exon 4 in some transcripts (superior, red) caused by the c.207-11 C > A SASS6 variant in Proband 1, in contrast to canonical splicing seen in unrelated LCL cases (inferior, blue). D Case 1: SASS6 exon 4 skipping results in partial deletion of the highly conserved PISA domain. Proband 1’s variants, as well as previously reported disease-causing non-truncating variants in SASS6 are also demonstrated (in red). One is a missense variant (c.185 T > C, bolded) encoding a residue within the PISA domain which is highly conserved across multiple species. E Case 1: Superior image shows reference wildtype SASS6 protein model generated by ColabFold [34], demonstrating normal SASS6 folding. The PISA functional domain is depicted in purple. Inferior image shows model of proband 1’s SASS6 protein folding, as predicted by ColabFold, demonstrating the impact of SASS6 p.70-104 del including part of the PISA functional domain (purple) resulting from exon 4 skipping induced by Proband 1’s c.207-11 C > A variant. F Case 2: Sashimi plot of NFU1 RNA-seq data in fibroblasts demonstrating extension of exon 1 and reduced coverage of exon 3, linked to the c.62 + 89G > A variant in Proband 2 (red), consistent with alternative isoforms (2, 3, and 4 shown in black below the plot). In contrast, normal splicing patterns seen in controls (blue). The predominant NFU1 isoforms are displayed in the inferior panel in black. G Case 2: NFU1 isoform usage in proband 2 compared to tissue-matched samples. The heatmap demonstrates RSEM (RNA-Seq by Expectation-Maximization) isoform percentages from 0% (blue to 100% (red). Proband 2’s isoform usage is shown in the first column, and tissue matched samples are in the following right-hand columns. NFU1 isoform usage in proband 2 is markedly skewed away from isoform 1 (ENTS00000410022, 15%) and toward isoforms 2 (ENTS00000303698, 56%), 3 (ENTS00000394305 at 10%) and 4 (ENTS00000450796 at 11%) compared to controls. H Case 2: Superior image shows reference predominant NFU1 isoform 1 (ENTS00000410022) protein model generated by ColabFold [34], where the first coding exon sequence is depicted in blue and the second exon is in orange. Inferior image shows model of NFU1 isoform 2 (ENTS00000303698) as generated by ColabFold, predominant in proband 2 due to the c.62 + 89G > A variant. Isoform 2 uses a more downstream start codon resulting in N-terminal shortening compared to isoform 1, with loss of the amino acids from the first coding exon as well as the second exons first three amino acids within the protein. I Case 2: Proband 2’s pyruvate dehydrogenase (PDH) enzyme activity is charted in comparison to reference ranges, demonstrating low PDH enzyme activity (both native and DCA-activated), normal PDH subunit enzyme testing (E1, E2 and E3), and an elevated Lactate/Pyruvate ratio. J Case 3: Clinical photographs of proband 3 taken at ages 6 (top) and 11 (bottom) demonstrating distinctive facial features
Fig. 3
Fig. 3
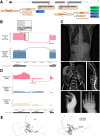
RNA-seq Results for Probands with Canonical Splicing Variants and Atypical Phenotypes. A Summary of positive RNA-seq results for CSSVs. 2 variants under investigation (depicted in red) were at canonical donor splice sites and 3 were at acceptor sites. 4 variants lead to out-of-frame exon-shortening causing frameshift (Cases 13, 15, and 16, left) and 1 variant caused out-of-frame exon skipping causing frameshift (Cases 14 and 17). B Case 13: EFTUD2 Sashimi plots display out-of-frame splicing in Proband 13 at the variant site compared to tissue-matched samples. The superior panel displays the proband’s blood RNA-seq results at the EFTUD2 locus (red) which showcases out-of-frame splicing in 11 reads resulting from the c.702 + 1 delG variant, compared to unrelated blood RNA-seq cases where all reads display normal splicing (blue). The superior call-out displays the Integrative Genomics Viewer graphics at the splice site, demonstrating that the abnormal splicing causes a 1 bp shorter transcript in ~ 14% of reads, predicted to result in a frameshift. C Case 14: Proband 14 X ray and MRI demonstrate situs inversus and polydactyly. The top panel is a chest x-ray demonstrating situs inversus totalis, hypoplastic right third rib, left L2 hemivertebrae and levoconvex scoliosis of 26 degrees. Middle panels show MRI spine demonstrating abdominal situs inversus, levoconvex curvature deformity with left hemi vertebra at L2. Middle right panel shows segmental expansile syrinx at T8 to the conus with smaller segmental expansion at C5-T1. There is also mild distention of the central canal in the thoracic cord. Inferior panels are right hand X-rays demonstrating right pre-axial polydactyly. D Case 14: TBX6 sashimi plots from Proband 14 at the variant site compared to unaffected parents. Skipping of exon 2 caused by the c.118 + 2 T > C variant is seen in 80% of proband 14’s transcripts (superior, red), while the same event is seen in 30% of transcripts in his father (middle, yellow). Skipping is not seen in his mother as she does not carry the splice variant (bottom, red). E Case 14: Superior image shows reference wildtype TBX6 protein model generated by ColabFold, [34] demonstrating normal TBX6 folding. The N-terminal domain is depicted in purple. Inferior image shows model of proband 14’s TBX6 protein folding, as predicted by ColabFold, demonstrating the impact of N-terminal truncation of TBX6 due to use of the M53 downstream start codon, as predicted to result from exon 2 skipping induced by Proband 14’s c.118 + 2 T > C variant
Fig. 4
Fig. 4
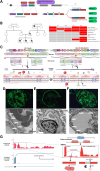
RNA-seq results for probands with candidate copy number variants. A Summary of positive RNA-seq results for CNVs. The four variants under investigation (depicted in red) were multi-exon duplications. RNA-seq confirmed all 4 duplications were in-tandem. One led to an in-frame duplication (Case 19), 2 led to out-of-frame aberrant splicing resulting in transcript truncation (Cases 18 and 21), and 1 led to both in-frame and some out-of-frame transcript due to some intron retention (Case 20). B Case 19: Proband 19’s pedigree (left) and characteristics of affected family members (right). Arrow indicates the proband. Affected family members are either hemizygous or heterozygous for familial COL4 A5 variant. C Case 19: Proposed hypomorphic mechanism of COL4 A5 with exon 10-24 duplication. The left panel illustrates how normal Col4a5 joins with collagen alpha-3 and alpha-4 chains to form the glomerular basement membrane (GBM). The right panel shows Proband 14’s intragenic duplication of exons 10-24, confirmed to be in tandem by RNA-seq. The call-out box depicts split-reads found in Proband 19’s RNA-seq using a modified genome backbone harbouring the duplication, which shows in-frame splicing between exons at the border of the tandem duplication. This is predicted to result in an elongated abnormal Col4a5 protein. While this abnormal protein still localizes to the GBM, it causes partial barrier dysfunction is proposed to lead to the proband’s mild phenotype. DF Case 19: Proband 19 renal biopsies demonstrate Col4a5 protein stability. Renal biopsies display indirect immunofluorescence staining for type IV collagen α5 chain (superior panel) and electron microscopy (inferior panel) of the glomerulus. D Normal control kidney demonstrating normal diffuse linear a5 staining pattern in glomerular basement membranes (GBM), Bowman’s capsule, and distal tubular basement membranes, and intact GBM of normal thickness (~ 307 ± 27 nm) for age-matched controls. E Reference male with X-linked Alport syndrome, with global loss of a5 staining in the GBM with preserved staining in Bowman’s capsule and thickening and irregular contours of the GBM with splitting of the lamina densa. F Proband 19 with normal diffuse a5 staining and slight thinning of the GBM. G Case 20: CDKL5 Sashimi plots displays tandem duplication of exons in Proband 20 compared to tissue-matched samples, using a modified genome backbone harbouring the duplication (where an additional exon 2-5 sequence was inserted just downstream of the original exon 5 to visualize the split reads spanning the breakpoint). LCL RNA-seq revealed an in-frame, tandem inclusion of the duplicated exons 2-5. However, a significant portion of reads also exhibited intron-retention, which is predicted to be out-of-frame and likely subject to nonsense-mediated decay (NMD)
Fig. 5
Fig. 5
RNA-seq results for probands with candidate regulatory non-coding variants. A Summary of positive RNA-seq results for regulatory variants (red). Two were missense variants in the 5′UTR, while three were copy number variants (two duplications and one deletion) affecting the 5′UTR and upstream regulatory region. RNA-seq demonstrated that one of the 5′UTR variants led to the repression of transcription (Case 24), while one of the duplications resulted in upregulation of another distant gene (Case 28). B Case 14: Proband 14’s bilateral hand and foot X-rays demonstrating diffuse osteopenia, sclerotic lucencies along the midshaft regions of the proximal phalanges with squared or under-tubulation remodelling and coarse appearance of the medullary zone of the small bones of the hand. There are acro-osteolysis again noted involving the tufts of the distal phalanges. C Case 14: Results of in vitro functional testing for MPS-1; α-L-iduronidase enzyme activity assays. Activity is expressed as nanomoles of phenol liberated during 18-h incubation per mg of protein. Times when the proband was receiving ERT are highlighted in green, and times without ERT are in red. D Case 14: Depiction of Proband 14’s compound heterozygous IDUA variants. The superior panel demonstrates the pathogenic c.1205G > A variant which results in introduction of an early stop codon and is predicted to result in nonsense-mediated decay. The inferior panel demonstrates the c.-87 T > C in the 5’UTR, located at the + 2-position relative to the transcription start site, suggesting its role in in downregulating transcription. E Case 14: IDUA RNA-seq in LCLs from Proband 14 demonstrates 97% skew towards the allele harboring the known pathogenic variant, resulting in the predominance of the wild-type A nucleotide (corresponding to amino acid 402). F Case 14: HEK-293 cells transfected with the patient variant demonstrated decreased promoter efficiency compared with wild type IDUA promoter region. The left panel shows EGFP signal from cells transfected with wild type IDUA promoter in contrast to the right panel showing EGFP signal from cells transfected with probands 14’s IDUA promotor affected by the c.-87 T > C 5′UTR variant. eGFP gene expression level from RT-qPCR are compared in the center bar graph (mean ± SEM; *: P < 0.05). G Case 28: Sashimi plots display expression of BEND2 in fibroblasts from the mother of Proband 28, highlighting the MAMLD1 regulatory region, compared to controls. RNA-seq from fibroblasts reveals multiple split reads, with the two most prominent mapping from a duplicated non-coding exons 3 and 4 of the MAMLD1 5′UTR to coding exon 7 of the distant BEND2 gene, located on the other end of the X-chromosome. The details of the split read sequences are depicted in the right panel. H Case 28: This panel illustrates a proposed molecular mechanism of the MAMLD1-BEND2 fused transcript, inferred from the RNA-seq analysis of Proband 28. It is hypothesized that the MAMLD1 duplication has been inserted upstream of BEND2, likely upstream of its exon 7. This insertion may lead to the activation of a truncated BEND2 protein expressed under regulation of the MAMLD1 promoter and 5’UTR. The truncated protein is predicted to be translated from a downstream start codon (Met 353), causing N-terminal truncation but thereby keeping the two downstream functional BEND domains intact. This is demonstrated by the below Colabfold protein model [34] predicting folding of proband 28’s truncated BEND2 (446 amino acids), where the 2 BEND functional domains are depicted in blue and green. The model to the right shows the reference wildtype BEND2 protein model with an intact N-terminal end (799 amino acids)
Fig. 6
Fig. 6
Summary of study outcomes. A Summary of the candidate variants examined by RNA-seq and their observed impact. Clinical diagnostic outcomes for the candidate variants are demonstrated in the pie chart, where colour corresponds to the outcome as indicated in the legend; green indicates a diagnostic outcome for the proband, red indicates the diagnosis was ruled out, the other results indicate ongoing diagnostic uncertainty due to either an RNA VUS (blue), a result ruling out a transcript effect in context of another possible mechanism of pathogenicity (yellow) or an unsuccessful result (grey). See also Figure S1 for Sashimi plots for all probands with positive RNA-seq results not highlighted in the main text, and Additional file 3: Table S2 for detailed summaries of all probands’ RNA-seq findings. B Suggested approach for the clinical application of RNA-seq in patients with suspected Mendelian disease. *RNA-seq should be conducted on tissue where adequate expression of the target gene of interest has been confirmed. **Alternate genomic investigations may include broader genome sequencing, WES/WGS re-analysis, refined tests such as methylation or repeat expansion studies, and long-read genomic sequencing. Furthermore, functional assays or other research testing may be considered

References

    1. Gonorazky HD, Naumenko S, Ramani AK, Nelakuditi V, Mashouri P, Wang P, et al. Expanding the boundaries of RNA sequencing as a diagnostic tool for rare Mendelian disease. The American J Human Genet. 2019 Mar;104(3):466–83. Available from: https://linkinghub.elsevier.com/retrieve/pii/S0002929719300126 - PMC - PubMed
    1. Kremer LS, Bader DM, Mertes C, Kopajtich R, Pichler G, Iuso A, et al. Genetic diagnosis of Mendelian disorders via RNA sequencing. Nat Commun. 2017Jun;8:15824. - PMC - PubMed
    1. Yépez VA, Gusic M, Kopajtich R, Mertes C, Smith NH, Alston CL, et al. Clinical implementation of RNA sequencing for Mendelian disease diagnostics. Genome Med. 2022Apr;14(1):38. - PMC - PubMed
    1. Kernohan KD, Boycott KM. The expanding diagnostic toolbox for rare genetic diseases. Nat Rev Genet. 2024;25(6):401-15. 10.1038/s41576-023-00683-w. - PubMed
    1. Jaramillo Oquendo C, Wai HA, Rich WI, Bunyan DJ, Thomas NS, Hunt D, et al. Identification of diagnostic candidates in Mendelian disorders using an RNA sequencing-centric approach. Genome Med. 2024 Sep;16(1):110. Available from: https://genomemedicine.biomedcentral.com/articles/10.1186/s13073-024-013... - PMC - PubMed

LinkOut - more resources