

Changes in the epidemic patterns of respiratory pathogens of children in guangzhou, China during the COVID-19 pandemic
- PMID: 40597730
- PMCID: PMC12210601
- DOI: 10.1186/s12879-025-11215-8
Changes in the epidemic patterns of respiratory pathogens of children in guangzhou, China during the COVID-19 pandemic
Abstract
Objective: To investigate the epidemiological characteristics of pediatric respiratory pathogens in Guangzhou, China, from 2018 to 2023 in the context of the COVID-19 Pandemic and to evaluate the impact of non-pharmaceutical interventions (NPIs) on the transmission dynamics and seasonal patterns of respiratory pathogens.
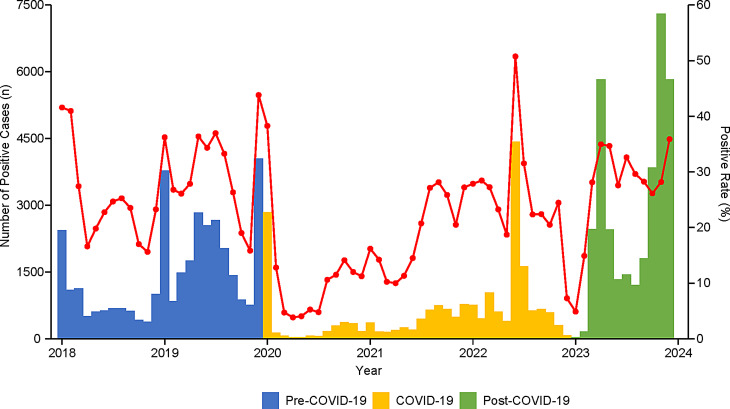
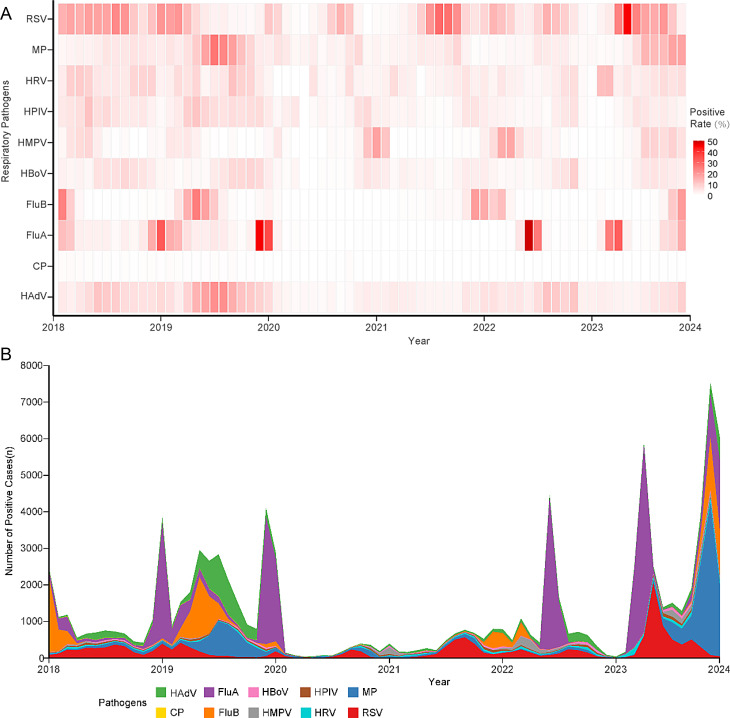
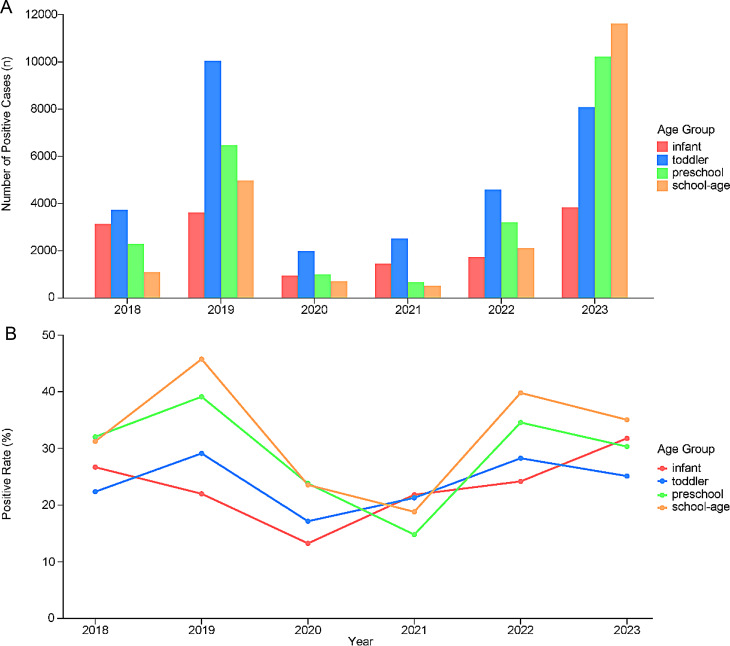
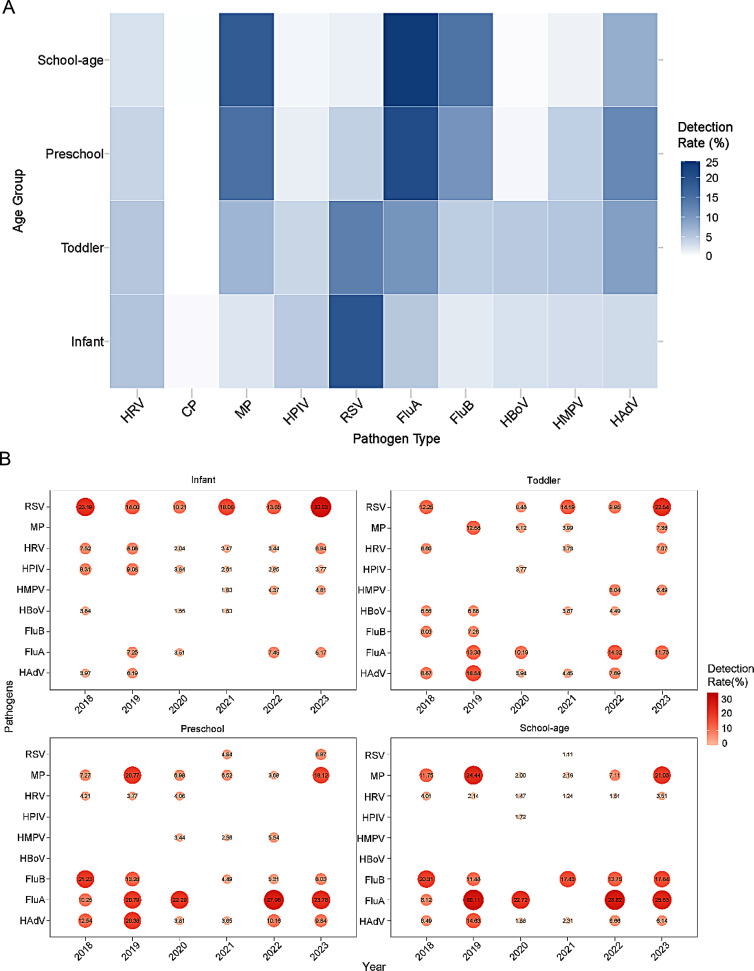
Methods: A retrospective analysis was conducted at Guangzhou Women and Children's Medical Center between January 2018 and December 2023. Pediatric patients who underwent the respiratory pathogens tests were enrolled in the study and divided into four groups by age: Infant group, Toddler group, Preschool group, and School-age group. The nasopharyngeal swab or bronchoalveolar lavage fluid (BALF) samples were collected for real-time fluorescence quantitative polymerase chain reaction (qPCR) test of respiratory pathogens. Ten common respiratory pathogens, including respiratory syncytial virus (RSV), Mycoplasma pneumoniae (MP) and Influenza A virus (FluA), were detected. In addition, the study period was divided into three phases: Pre-COVID-19 (2018-2019), COVID-19 (2020-2022), and Post-COVID-19 (2023). Detection rates, distribution patterns, and seasonal variations of respiratory pathogens were analyzed between different phases and different age groups.
Results: This study included 317,828 pediatric patients (median age: 3.4 years, IQR: 1.3-6.0), from whom 1,160,764 respiratory pathogen tests were conducted. The overall pathogen detection rate was 8.02% (93,108/1,160,764). The positive rate during the COVID-19 phase (18.44%, 95% CI 14.89-22.00%) was significantly lower than that of the Pre-COVID-19 (27.55%, 95% CI 23.95-31.16%) and Post-COVID-19 (27.15, 95% CI 21.47-32.84%) phases (P < 0.001). No significant difference was observed between Pre-COVID-19 and Post-COVID-19 phases (P = 0.948). Different pathogens exhibited varying levels of suppression and recovery patterns, with some demonstrating altered seasonal patterns. The primary affected age groups shifted from infants and toddlers during the Pre-COVID-19 and COVID-19 phases to preschool and school-age children in the Post-COVID-19 phase. Co-infections were identified in 2,515 cases, with the highest rate observed during the Pre-COVID-19 phase (3.40%), followed by the COVID-19 (2.26%) and Post-COVID-19 (2.46%) phases.
Conclusions: NPIs implemented during the early COVID-19 pandemic effectively suppressed the transmission of respiratory pathogens and disrupted their seasonal patterns. However, some pathogens gradually resumed activity during the mid-to-late COVID-19 phase, leading to atypical outbreaks. Following NPI relaxation, multiple pathogens rebounded during the Post-COVID-19 phase, posing significant challenges for the healthcare system. These findings offer valuable insights for guiding public health strategies and optimizing the prevention and control of respiratory infections.
Clinical trial number: Not applicable.
Keywords: COVID-19; Children; Epidemiological characteristics; Non-Pharmaceutical interventions; Respiratory pathogens.
© 2025. The Author(s).
Conflict of interest statement
Declarations. Ethical approval and consent to participate: This study was approved by the Ethics Committee of Guangzhou Women and Children’s Medical Center (505A01). All participants voluntarily signed a written informed consent with a full understanding of the purpose and process of the research. All procedures performed involving human participants were in accordance with the ethical standards of the institutional and/or National Research Committee and consistent with the 1964 Helsinki Declaration and its later amendments or comparable ethical standards. Consent for publication: Not applicable. Competing interests: The authors declare no competing interests.
Figures

References
-
- Zar HJ, Ferkol TW. The global burden of respiratory disease-impact on child health. Pediatr Pulmonol. 2014;49(5):430–4. - PubMed
-
- Lei H, Wu X, Wang X, Xu M, Xie Y, Du X, Cowling BJ, Li Y, Shu Y. Different transmission dynamics of coronavirus disease 2019 (COVID-19) and influenza suggest the relative efficiency of isolation/quarantine and social distancing against COVID-19 in China. Clin Infect Dis. 2021;73(11):e4305–11. - PMC - PubMed
MeSH terms
Grants and funding
LinkOut - more resources
Full Text Sources
Medical
