

Predicting abnormal epicardial adipose tissue in psoriasis patients by integrating radiomics from non-contrast chest CT with serological biomarkers
- PMID: 40597754
- PMCID: PMC12220176
- DOI: 10.1186/s12880-025-01755-5
Predicting abnormal epicardial adipose tissue in psoriasis patients by integrating radiomics from non-contrast chest CT with serological biomarkers
Abstract
Background: Psoriasis patients frequently present with cardiovascular comorbidities, which maybe associated with abnormal epicardial adipose tissue (EAT). This study aimed to evaluate the predictive value of radiomics features derived from non-contrast chest CT (NCCT) combined with serological parameters for identifying abnormal EAT in psoriasis.
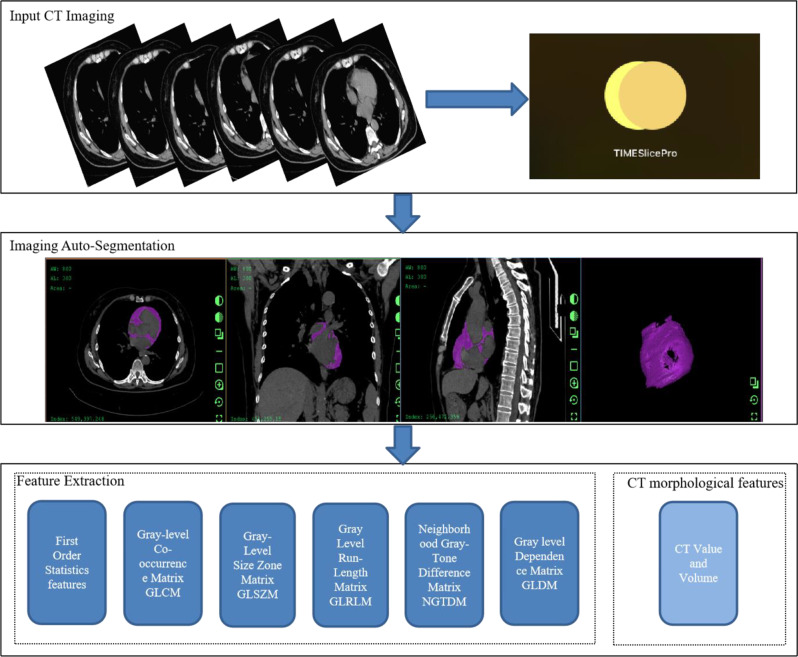
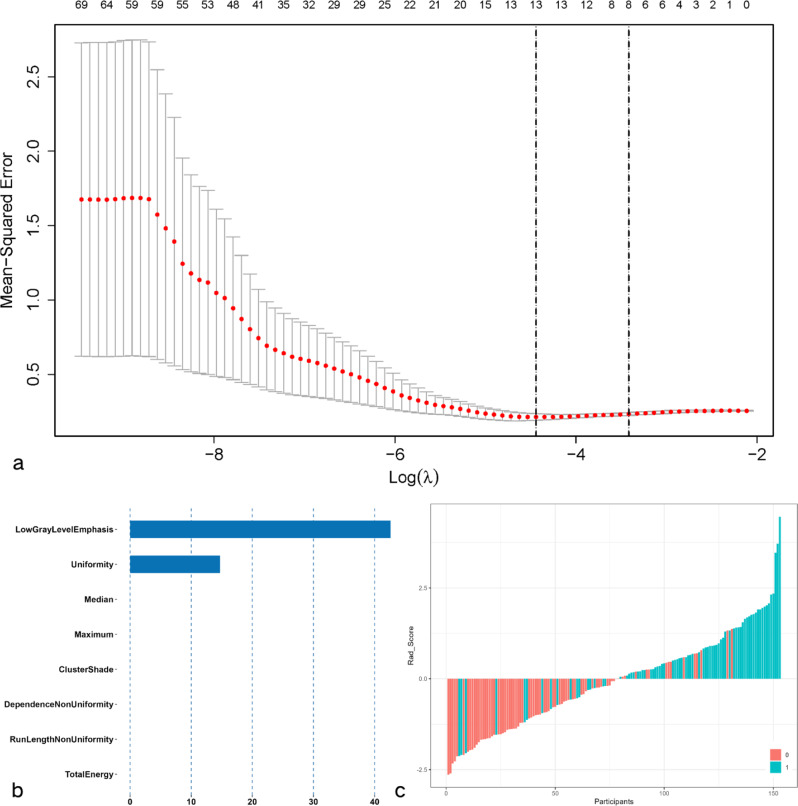
Methods: In this retrospective case-control study, we enrolled consecutive psoriasis patients who underwent chest NCCT between September 2021 and February 2024, along with a matched healthy control group. Psoriasis patients were stratified into mild-to-moderate (PASI ≤ 10) and severe (PASI > 10) groups based on the Psoriasis Area and Severity Index (PASI). Using TIMESlice, we extracted EAT volume, CT values, and 86 radiomics features. The cohort was randomly divided into a training (70%) and test (30%) set. LASSO regression selected radiomic features to calculate the Rad_Score. Serum uric acid (UA) and C-reactive protein (CRP) levels were collected. We compared EAT volume, CT values, Rad_Score, UA, and CRP between groups and developed three models: Model A (UA, CRP, EAT CT values), Model B (Rad_Score), and Model C (UA, CRP, EAT CT values, Rad_Score). Model accuracy was evaluated using ROC curves (P < 0.05).
Results: The study included 77 psoriasis patients and 76 matched controls. Psoriasis patients had higher UA and CRP levels than controls (both P < 0.001). EAT CT value was higher in psoriasis (P = 0.020), with no volume difference. Eight radiomics features and Rad_Score significantly differed between groups (P < 0.001), and Rad_Score also higher in severe group than that in mild-to-moderate group (P < 0.001). Model C showed the highest AUC in both sets: training 0.947 and test 0.895, indicating superior predictive performance.
Conclusions: Combining radiomics features, EAT CT values, UA, and CRP in a predictive model accurately predicts EAT abnormalities in psoriasis, potentially improving cardiovascular comorbidity diagnosis.
Clinical trial number: Not applicable.
Keywords: Computed tomography; Epicardial adipose tissue; Psoriasis; Radiomics.
© 2025. The Author(s).
Conflict of interest statement
Declarations. Ethical approval and consent to participation: The Ethics Committees of the of the institutional ethics board of Wuhan No.1 Hospital and waived the need for informed consent from patients (approval number: [2024] 80). All methods were carried out in accordance with relevant guidelines and regulations. Consent for publication: Not applicable. Competing interests: The authors declare no competing interests.
Figures


References
-
- Committee on Psoriasis CSoD, Xuejun Z. Guideline for the diagnosis and treatment of psoriasis in China (2023 edition). Chin J Dermatology 2023.
-
- Parisi R, Symmons DP, Griffiths CE, Ashcroft DM, Identification. Management of P, associated comorbidity project t: global epidemiology of psoriasis: a systematic review of incidence and prevalence. J Invest Dermatol. 2013;133(2):377–85. - PubMed
-
- L LW HLLHYZJZ, H TG. Analysis of the epidemiological burden of psoriasis in China based on the big data of global burden of disease study. China J Dermatovenereol. 2021;35:386–92.
-
- Aurangabadkar SJ. Comorbidities in psoriasis. Indian J Dermatol Venereol Leprol. 2013;79(Suppl 7):S10–17. - PubMed
-
- Cozzani E, Rosa GM, Burlando M, Parodi A. Psoriasis as a cardiovascular risk factor: updates and algorithmic approach. G Ital Dermatol Venereol. 2018;153(5):659–65. - PubMed
MeSH terms
Substances
Grants and funding
LinkOut - more resources
Full Text Sources
Medical
Research Materials
Miscellaneous
