. 2025 Jul 1;25(1):1118.
doi: 10.1186/s12885-025-14448-7.

Circulating tumor cells and clusters as liquid biomarkers for the diagnosis and prognosis of neuroblastoma

Affiliations

Circulating tumor cells and clusters as liquid biomarkers for the diagnosis and prognosis of neuroblastoma

Huanli Xu et al. BMC Cancer. .

Abstract

Background: The clinical significance of circulating tumor cell (CTC) clusters in highly metastatic tumors hasn't yet been revealed. Here, we demonstrated the diagnostic and prognostic value of CTC clusters in neuroblastoma (NB) which is the most prevalent childhood extracranial solid tumor.

Methods: We employed cascaded filter deterministic lateral displacement microfluidic chips to enrich CTCs and CTC clusters in 64 newly diagnosed NB patients. CTCs and CTC clusters were identified by CD45-, GD2+/PHOX2B+, DAPI + immunofluorescence staining, with cells displaying characteristic neoplastic morphology.

Results: Among NB patients, 85.94% and 50.00% were positive for CTCs and CTC clusters, respectively; no CTCs or CTC clusters were detected in healthy children. Moreover, CTC and CTC cluster numbers differed significantly across different primary sites, clinical and pathologic features, and risk stratifications, while no significant differences in CTC and CTC cluster counts were observed in relation to sex, age, and MYCN gene amplification. CTCs and CTC clusters indicated metastasis and strongly correlated with minimal residual disease. Of note, CTC clusters ≥ 2.5/2 mL were closely associated with bone marrow metastasis and demonstrated significant differences in the hazard ratio of overall survival.

Conclusions: CTCs and CTC clusters are sensitive non-invasive biomarkers for NB diagnosis and prognosis, especially the prominent role in tumor emergencies. CTC clusters closely correlate with bone marrow metastasis and represent promising indicator for the monitoring of metastasis in NB emergencies. The mechanisms of CTC cluster formation and their specific role in the metastasis cascade deserve further elucidation which may serve as targets to inhibit NB bone marrow metastasis.

Keywords: Circulating tumor cell; Circulating tumor cell cluster; Liquid biopsy; Microfluidic chip; Neuroblastoma.


Conflict of interest statement

Declarations. Ethics approval and consent to participate: Ethical approval for the research was granted from the Shenzhen Children’s Hospital Ethics Committee. All patients consented to donate samples to this study. The study was performed in accordance with the Declaration of Helsinki. Consent for publication: Not applicable. Competing interests: The authors declare no competing interests.

Figures
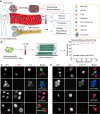
Fig. 1
Fig. 1
Study design and identification of circulating tumor cells (CTCs) and CTC clusters in neuroblastoma (NB) patients by immunofluorescence. A, Schematic diagram of the study design. NB patient clinical and pathological characteristics were recorded and cascaded filter deterministic lateral displacement microfluidic chip (CFD-Chip) was employed to enrich CTCs and CTC clusters in peripheral blood. B, The capture efficiency of SK-N-SH tumor cells in the PB samples by the CFD-Chip. C-D, GD2 and PHOX2B were confirmed to be NB-specific markers expressed in CTCs and CTC clusters. CTCs were detected by at least one NB specific marker (GD2 or PHOX2B) expression, an intact nuclear signal, and the absence of CD45 expression by immunofluorescence. CTC clusters were identified as aggregations of two or more CTCs. Scale bar, 10 μm
Fig. 2
Fig. 2
CTC and CTC cluster detections enable NB emergency patients to receive risk-adapted chemotherapy as early as possible. A, Schematic diagram of emergency NB treatment. Radiographic imaging and liquid biopsy including CTC detection, facilitate rapid diagnosis of NB, while histopathology takes longer and is sometimes non-implementable. B, Representative MRI images of posterior mediastinal NB emergencies. (#1) Superior vena cava syndrome: the transverse fat-suppressed enhanced T1-weighted imaging sequence showed a large uneven enhanced mass in the left posterior mediastinum. The lesion invaded into the spinal canal, surrounded and moved the corresponding spinal cord, grew across the midline, and involved the adjacent trachea, esophagus, superior vena cava, and aortic arch. (#2) Spinal cord compression: the transverse T2-weighted imaging sequence showed a large contour mass image in the right posterior mediastinum, with significant lesion occupying effect. The adjacent mediastinum was shifted to the left, the lesion locally grew into the adjacent spinal canal, and the corresponding spinal cord was compressed and displaced. C, Hematoxylin and eosin (H&E) staining and immunohistochemistry were used for histopathological diagnosis of NB patients. (1) The small round tumor cells infiltrate extensively, forming a Homer-Wright rosette arrangement around neurofibrils. (2) Metastatic tumor cells are present in the bone marrow biopsy tissue. (3) Immunohistochemical staining shows cytoplasmic positivity for TH in the tumor cells. (4) Immunohistochemical staining shows nuclear positivity for PHOX2B in the tumor cells. Scale bar, 50 μm
Fig. 3
Fig. 3
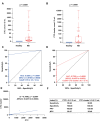
The diagnostic value of CTCs and CTC clusters for distinguishing healthy children and NB patients at first diagnosis. A-B, The positive rate and count of CTC and CTC cluster in primary NB were significantly higher than those in healthy children (Mann-Whitney test, p < 0.001). a, CTC count in 64 primary NB while it was negative in 20 healthy children. b, CTC cluster count in primary NB and healthy children. C-D, Receiver operating characteristic (ROC) curves for distinguishing between newly diagnosed NB patients from healthy children. C, The area under ROC curve (AUC) of the predictive model for CTC was 0.9297 (95% CI: 0.8758 to 0.9835, p < 0.0001) and the optimal threshold was CTC ≥ 0.5/2 mL. D, AUC of CTC cluster was 0.7500 (95%CI: 0.6478 to 0.8522, p = 0.0008) and the optimal threshold was CTC cluster ≥ 0.5/2 mL. E, There was a significant positive correlation between the number of CTC and CTC cluster count (Spearman test, rs = 0.7596, 95%CI: 0.6272 to 0.8493, p < 0.0001). F, The predictive index including sensitivity, specificity, positive predictive value (PPV) and negative predictive value (NPV) of CTCs and CTC clusters, respectively
Fig. 4
Fig. 4
CTC and CTC cluster count correlated with primary NB tumor site and stage A-C, There was no significant difference in the count of CTC and CTC cluster at first diagnosis according to A, sex B, age, and C, MYCN gene amplification. (Mann-Whitney test, p > 0.05). D, CTC and CTC cluster count of primary NB in retroperitoneum were statistical higher than the counterpart in mediastinum or other sites. (Mann-Whitney test, p = 0.0018 for CTCs and p = 0.0171 for CTC clusters). E, CTC and CTC cluster positive rate and count of different risk classification were statistically significant. (Kruskal-Wallis test, p = 0.0038 for CTCs and p = 0.0013 for CTC clusters). F, There were more CTC and CTC cluster in NB than that of GNBi, GN, and GNBn according to the pathological classification. (Kruskal-Wallis test, p = 0.0003 and p = 0.0157 respectively). G, Counts of CTCs and CTC clusters in in stage 4 according to INSS were significantly higher than that of 1, 2, 3, 4s (Kruskal-Wallis test, p = 0.0088 and p = 0.0001 respectively). H, CTC and CTC cluster counts in M were statistically high compared with L1, L2, and Ms stages according to the INRGSS. (Kruskal-Wallis test, p = 0.0008 for CTC and p < 0.0001 for CTC cluster). The boxplot presents all points, boxes represent the interquartile range, horizontal lines within the boxes represent the median, and whiskers represent the minimum and maximum values for A-H
Fig. 5
Fig. 5
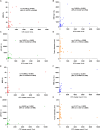
CTC and CTC cluster counts predict bone marrow metastasis and metastasis of NB at initial diagnosis. A, CTC and CTC cluster counts in primary NB with bone metastasis were significantly higher than those without bone metastasis (Mann-Whitney test, p < 0.0001). B, CTC and CTC cluster counts in primary NB with bone marrow metastasis were significantly higher than those without bone marrow metastasis (Mann-Whitney test, p < 0.0001). C, There were statistically significant difference of CTC and CTC cluster counts between metastatic and non-metastatic NB (Mann-Whitney test, p < 0.0001). D-F, ROC curves for distinguishing between bone marrow metastasis from bone marrow metastasis free in primary NB patients. D, For the CTC prediction model, the AUC was 0.8870 (95%CI: 0.8079 to 0.9661), and the best cutoff value was 5.5 CTC/2 mL. E, For the CTC cluster prediction model, the AUC was 0.9021 (95%CI 0.8164 to 0.9877), and the optimal cutoff value was 2.5/2 mL. F, The predictive index including sensitivity, specificity, PPV and NPV of CTCs and CTC clusters. G-I, ROC curves for distinguishing between metastasis from metastasis free in primary NB patients. G, For CTC prediction of metastasis, the AUC was 0.8006 (95%CI 0.6928 to 0.9084), and the best cutoff value was 5.5 CTC/2mL. H, For the CTC cluster prediction model, the AUC was 0.8310 (95% CI: 0.7343 to 0.9277), and the optimal cutoff value was 0.5/2 mL. I, The predictive index including sensitivity, specificity, PPV and NPV of CTCs and CTC clusters for metastasis prediction
Fig. 6
Fig. 6
CTC and CTC cluster counts were correlated with serum NSE, LDH and BM MRD in newly diagnosed NB patients. A-C, The Spearman tests characterized statistically-significant correlation between A, CTC and MRD (rs = 0.7254, 95% CI: 0.5727 to 0.8294, p < 0.0001). B, CTC and NSE (ng/mL) (rs = 0.6255, 95% CI: 0.4427 to 0.7583, p < 0.0001). C, CTC and LDH (IU/L) (rs = 0.6337, 95% CI: 0.4502 to 0.7659, p < 0.0001). D, CTC count was not correlated with NB tumor diameter (Spearman tests, p > 0.05). E-G, The Spearman tests illustrated the significant correlation between E, CTC cluster count and BM MRD (rs = 0.8089, 95% CI: 0.6944 to 0.8834, p < 0.0001). F, CTC cluster and NSE (rs = 0.6287, 95% CI: 0.4469 to 0.7606, p < 0.0001). G, CTC cluster and LDH (rs = 0.6818, 95% CI: 0.5152 to 0.7988, p < 0.0001). H, CTC cluster was not correlated with tumor diameter (Spearman tests, p > 0.05)
Fig. 7
Fig. 7
Predicting bone marrow metastasis and metastasis by combining CTC, CTC cluster, serum NSE and LDH information. A-C, ROC curves for distinguishing between BM metastasis and BM metastasis free. A, The AUC of NSE in predicting BM metastasis was 0.8771, and the optimal cutoff was 141.5 ng/mL with a sensitivity of 96.88% and specificity of 73.33%. (p < 0.0001). The AUC of LDH was 0.8359 and the optimal cutoff was 512 IU/L with a sensitivity of 78.13% and specificity of 78.57% (p < 0.0001). BM MRD detection was a convincing predictive model for BM metastasis with an AUC of 0.9700. B, The AUC of CTC for BM metastasis prediction was 0.8870. The AUC of model incorporating both CTC & NSE was 0.9302 (p < 0.0001). The AUC of CTC combined with LDH was 0.9040 (p < 0.0001), and the AUC of the model incorporating CTC & NSE & LDH was 0.9241 (p < 0.0001). C, The AUC of CTC cluster for BM metastasis prediction was 0.9021. The AUC of model incorporating both CTC cluster & NSE was 0.9135 (p < 0.0001). The AUC of CTC cluster & LDH model was 0.8940 (p < 0.0001) and the CTC cluster & NSE & LDH model was 0.9085, (p < 0.0001). D-F, ROC curves for distinguishing between metastasis and non-metastasis. D, the AUC for the NB metastasis predicted by NSE alone was 0.9368 (p < 0.0001), and the AUC for the NB metastasis predicted by LDH alone was 0.8758 (p < 0.0001) while that of MRD was 0.8352 (p < 0.0001). E, The AUC of model incorporating both CTC & NSE for metastasis was 0.9439 (p < 0.0001). The AUC of CTC combined with LDH in predicting metastasis was 0.8941 (p < 0.0001), and the AUC of the model incorporating CTC & NSE & LDH was 0.9346 (p < 0.0001). F, The CTC cluster combining NSE model had better metastasis prediction performance (AUC: 9661, p < 0.0001) than the CTC cluster & LDH model (AUC: 0.9085, p < 0.0001) or the CTC cluster & NSE & LDH model (AUC: 0.9556, p < 0.0001)
Fig. 8
Fig. 8
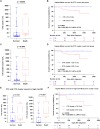
CTC and CTC cluster counts are associated with overall survival (OS) of NB patients at initial diagnosis. A, Patients who died had significantly higher CTC count than those who lived. (Mann-Whitney test, p = 0.0266). B, The hazard ratio (HR) for CTC high compared to CTC low patients was 9.503 (95% CI: 1.892 to 47.74, p = 0.0063, Log-rank test). C, CTC cluster count was significantly higher in patients who died than those who lived. (Mann-Whitney test, p = 0.0043). D, The HR for CTC cluster high compared to CTC cluster low patients was 7.776 (95% CI: 1.457 to 41.51, p = 0.0164, Log-rank test). E, For high-risk NB, there was no significant difference in CTCs between the 5 deceased and 35 surviving patients, while the CTC clusters were significantly higher (Mann-Whitney test). F, High-risk patients with ≥ 75 CTC clusters in 2 mL PB had a HR of 19.09 (95% CI: 2.976 to 122.4, p = 0.0019, Log-rank test) compared to those with CTC clusters below this threshold

Similar articles

References

    1. Stiller CA, Parkin DM. International variations in the incidence of neuroblastoma. Int J Cancer. 1992;52:538–43. - PubMed
    1. Schwab M, Westermann F, Hero B, Berthold F. Neuroblastoma: biology and molecular and chromosomal pathology. Lancet Oncol. 2003;4:472–80. - PubMed
    1. Qiu B, Matthay K. Advancing therapy for neuroblastoma. Nat Reviews Clin Oncol. 2022;19:515–33. - PubMed
    1. Matthay K, Maris J, Schleiermacher G, Nakagawara A, Mackall C, Diller L, Weiss W. Neuroblastoma. Nat Reviews Disease Primers. 2016;2:16078. - PubMed
    1. Zeineldin M, Patel A, Dyer M. Neuroblastoma: when differentiation goes awry. Neuron. 2022;110:2916–28. - PMC - PubMed

Substances