Multicenter Study
. 2025 Jul 1;25(1):1078.
doi: 10.1186/s12885-025-14457-6.

Early assessment of therapeutic efficacy in lymphoma patients via a blood-based multi-omics response monitoring test

Affiliations
Multicenter Study

Early assessment of therapeutic efficacy in lymphoma patients via a blood-based multi-omics response monitoring test

Xinhua Wang et al. BMC Cancer. .

Abstract

Background: Periodic fluorodeoxyglucose (FDG) positron emission tomography (PET)-computed tomography (CT)/CT-based response examinations are the current standard for clinical assessment of lymphoma treatment response. In this prospective study, we applied a blood-based multi-omics test, SeekInClarity, to assess treatment response and to predict therapeutic outcomes in the major lymphoma subtypes.

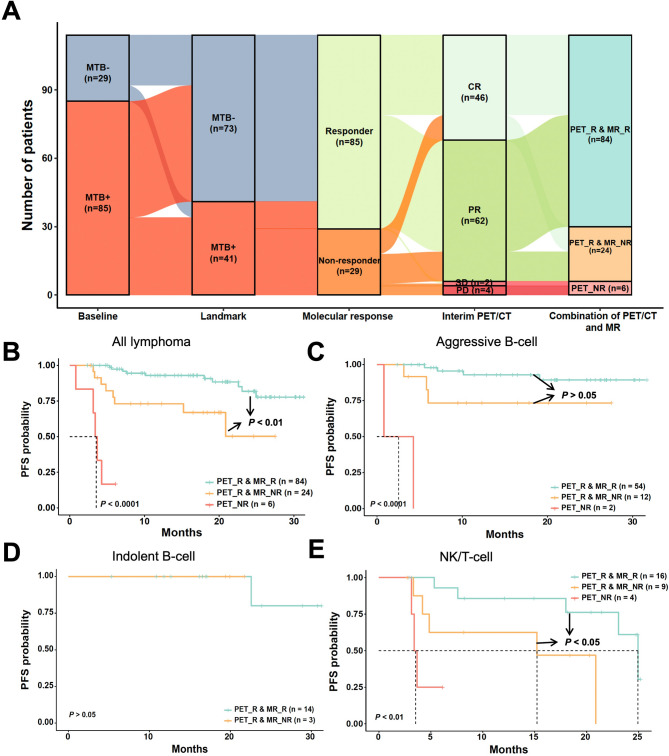
Methods: We prospectively recruited 116 lymphoma patients from two clinical centers, and collected blood samples at pre-treatment (baseline) and after two treatment cycles (landmark) to calculate molecular tumor burden (MTB) score using SeekInClarity. The "molecular response" framework, developed based on the MTB dynamic changes between baseline and landmark, was used to predict prompt treatment efficacy across various first-line regimens.

Results: Higher MTB scores correlated with advanced tumor stages, with MTB+ ratios of 31.8%, 63.6%, 84.6%, and 91.2% for stage I, II, III, and IV respectively. At landmark, MTB+ patients (n = 41) exhibited significantly worse progression-free survival (PFS, HR 7.78, 95% CI 3.00-20.18, P < 0.0001) and overall survival (OS, HR 4.14, 95% CI 1.03-16.59, P < 0.05) compared to the MTB- patients (n = 75). Multivariable Cox regression analysis demonstrated that only molecular response and interim PET/CT were independent predictor of treatment outcome, outperforming the clinical biomarkers B2M and LDH. Among the 108 patients with interim PET/CT response, SeekInClarity further identified 24 (22.2%) patients as molecular non-responders. Of these, 8 (33.3%) patients experienced disease progression within 27.5 months, while only 10 (11.9%) patients among the remaining 84 molecular responders progressed within 31.7 months. This significant difference indicated that molecular non-responders have notably worse PFS than molecular responders (P < 0.01), particularly in aggressive B-cell and NK/T-cell lymphomas. These findings underscore the added value of molecular profiling in refining risk stratification beyond imaging alone.

Conclusions: The SeekInClarity-based molecular response predicts prompt treatment efficacy and serves as a valuable complementary tool for identifying non-responders among interim PET/CT response patients.

Keywords: Efficacy assessment; Liquid biopsy; Lymphoma; Molecular response; Multi-omics.


Conflict of interest statement

Declarations. Ethics approval and consent to participate: This study was approved by the Ethics Committee of The First Affiliated Hospital of Zhengzhou University (2022-KY-0719-001). All experiments and procedures were conducted in accordance with relevant guidelines, regulations, local standards, and institutional requirements. Written informed consent was obtained from all participants before they participated in the study. Consent for publication: Not applicable. Competing interests: S. Li, W. Wu, and M. Mao are full-time employees and stock shareholders of SeekIn Inc. Y. Chang and D. Zhu are full-time employees of Shenyou Bio, a wholly-owned subsidiary of SeekIn Inc, and hold stock options in SeekIn Inc. F. Chang and D. Gong are full-time employee of Shenyou Bio. Other authors declare no potential conflicts of interest.

Figures

Fig. 1
Fig. 1
Detection rate of MTB+ in pre-treatment lymphomas. (A) Comparison of lymphoma detection performance using individual omics features versus the integrated MTB score. (B) Distribution of MTB score across different tumor stages. (C) Distribution of MTB score across various lymphoma subtypes. The statistical disparity in MTB scores relative to non-cancer individuals was evaluated via the Mann-Whitney U test, with results depicted above in panel B and C. A dotted line indicated the cutoff, and the proportion of patients with MTB scores above this line, classified as MTB+, was marked at the top of panel B and C. (D) Kaplan-Meier analysis of PFS in pre-treatment lymphomas, stratified by MTB status: MTB+ vs. MTB-. The PFS difference was calculated by the log-rank test. ***, P < 0.001; ****, P < 0.0001; HL, Hodgkin lymphoma; NHL, Non-Hodgkin lymphoma
Fig. 2
Fig. 2
Prognostic value of MTB score compared with traditional clinical markers at landmark. Kaplan-Meier analysis of PFS in lymphoma patients at landmark. (A) PFS stratified by MTB score at landmark: MTB ≥ 2 versus MTB < 2. (C) PFS was stratified by LDH levels measured at landmark: LDH ≥ 245 U/L versus LDH < 245 U/L. (E) PFS stratified by B2M levels measured at landmark: B2M ≥ 3 mg/L versus B2M < 3 mg/L. Subgroup analyses of PFS stratified by MTB score (B), LDH (D), and B2M (F) in aggressive B-cell lymphoma, indolent B-cell lymphoma, and NK/T-cell lymphoma. In panel B, the curves for MTB+ and MTB- in the indolent B‑cell subgroup completely overlap. The differences in PFS between risk groups were evaluated by the log-rank test. Panel G compared the rates of disease progression between MTB+ and MTB- patients, as well as between patients with high and low LDH and B2M levels. The P values were calculated using Fisher’s exact test. ns, not significant; *, P < 0.05; ***, P < 0.001
Fig. 3
Fig. 3
Treatment response predicted by molecular response and interim PET/CT. Long and short diameters of a lesion were assessed after two, four, and six cycles of treatment using CT (A). The lesion was marked by red arrows. (B) Dynamic changes in MTB score and imaging area at the corresponding treatment cycles. (C) Proportions of molecular responders and non-responders at landmark, grouped by the interim PET/CT results. Bar heights represent the proportional data, with the number of patients indicated inside each bar. (D) Among the patients with MTB+ at baseline, Boxplot depicting the distribution of MTB score reduction between interim PET/CT Response and No-response patients, with statistical analysis conducted using the Mann-Whitney U test. Kaplan-Meier analysis of PFS in all lymphoma patients (E) and across different subgroups (F), stratified by molecular response at landmark (Responder vs. Non-responder). The differences in PFS between risk groups were evaluated by the log-rank test. (G) Forest plot depicting hazard ratios for PFS based on the molecular response and clinical parameters, such as interim PET/CT, LDH levels, and B2M levels. PR, partial response; CR, complete response
Fig. 4
Fig. 4
Predictive value of treatment efficacy by molecular response and interim PET/CT results. (A) Alluvial plot illustrating the dynamic transition of patients across different response categories, based on MTB status at baseline and landmark, molecular response, interim PET/CT results, and their integrated classifications. (B) Kaplan-Meier survival curves depicting PFS among lymphoma patients, stratified by the combination of interim PET/CT results and molecular response. Patients were categorized into three groups based on their responses in both interim PET/CT and SeekInClarity. (CE) Subgroup analyses of PFS stratified by the same combined response criteria in (C) aggressive B-cell lymphoma, (D) indolent B-cell lymphoma (without PET_NR), and (E) NK/T-cell lymphoma. PET_NR, interim PET/CT No-response; PET_R, interim PET/CT Response; MR_NR, molecular response classified as Non-responder; MR_R, molecular response classified as Responder. The P values were calculated using the log-rank test

References

    1. Siegel RL, Miller KD, Wagle NS, Jemal A. Cancer statistics, 2023. CA Cancer J Clin. 2023;73(1):17–48. 10.3322/caac.21763. - PubMed
    1. Jeong SH. Treatment of indolent lymphoma. Blood Res. 2022;57(S1):S120–9. 10.5045/br.2022.2022054. - PMC - PubMed
    1. Miyazaki K. Treatment of diffuse large B-Cell lymphoma. J Clin Exp Hematop. 2016;56(2):79–88. 10.3960/jslrt.56.79. - PMC - PubMed
    1. Roschewski M, Staudt LM, Wilson WH. Diffuse large B-cell lymphoma-treatment approaches in the molecular era. Nat Rev Clin Oncol. 2014;11(1):12–23. 10.1038/nrclinonc.2013.197. - PMC - PubMed
    1. Rushton CK, Arthur SE, Alcaide M, et al. Genetic and evolutionary patterns of treatment resistance in relapsed B-cell lymphoma. Blood Adv. 2020;4(13):2886–98. 10.1182/bloodadvances.2020001696. - PMC - PubMed

Publication types

MeSH terms