

Involvement of dysregulated RNA binding protein and alternative splicing regulatory networks in diabetic nephropathy from type 2 albuminuric cohorts
- PMID: 40597902
- PMCID: PMC12220771
- DOI: 10.1186/s12882-025-04237-6
Involvement of dysregulated RNA binding protein and alternative splicing regulatory networks in diabetic nephropathy from type 2 albuminuric cohorts
Abstract
Background: Diabetic nephropathy (DN) is a primary contributor to end-stage renal disease, yet the underlying molecular mechanisms remain incompletely understood. This study aims to elucidate the role of RNA-binding proteins (RBPs) and RBP-alternative splicing (AS) regulatory networks in the pathogenesis of DN.
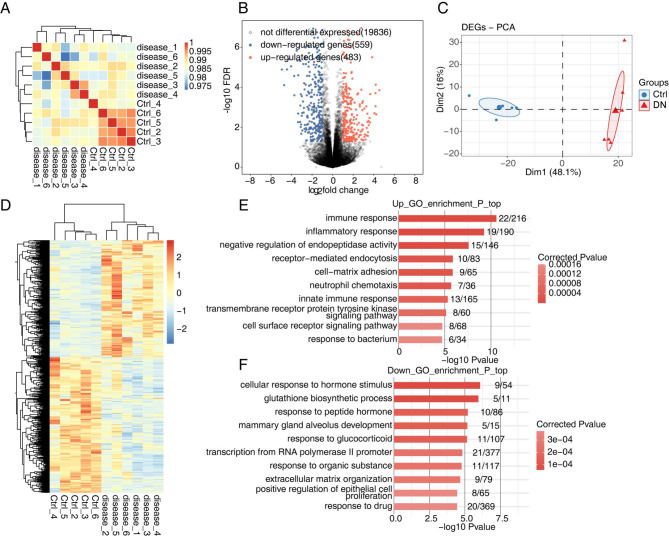
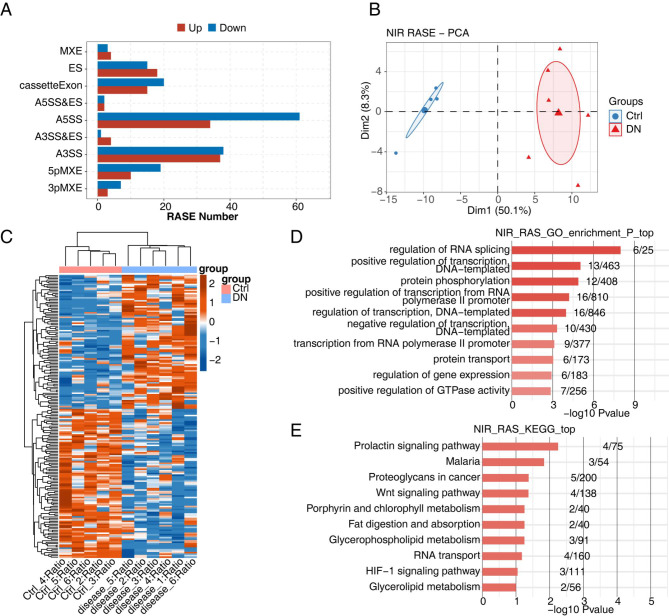
Methods: Two RNA-seq datasets (GSE117085 and GSE142025) were retrieved from the Sequence Read Archive (SRA) database. Regulated alternative splicing events (RASEs) and genes (RASGs) of RASEs, along with differentiated RBPs, were identified. Validated differentiated RBPs were correlated with clinical features using the Nephroseq v5 online platform. Using the DN mouse model and RT-qPCR, validated the alternative splicing of RNA.
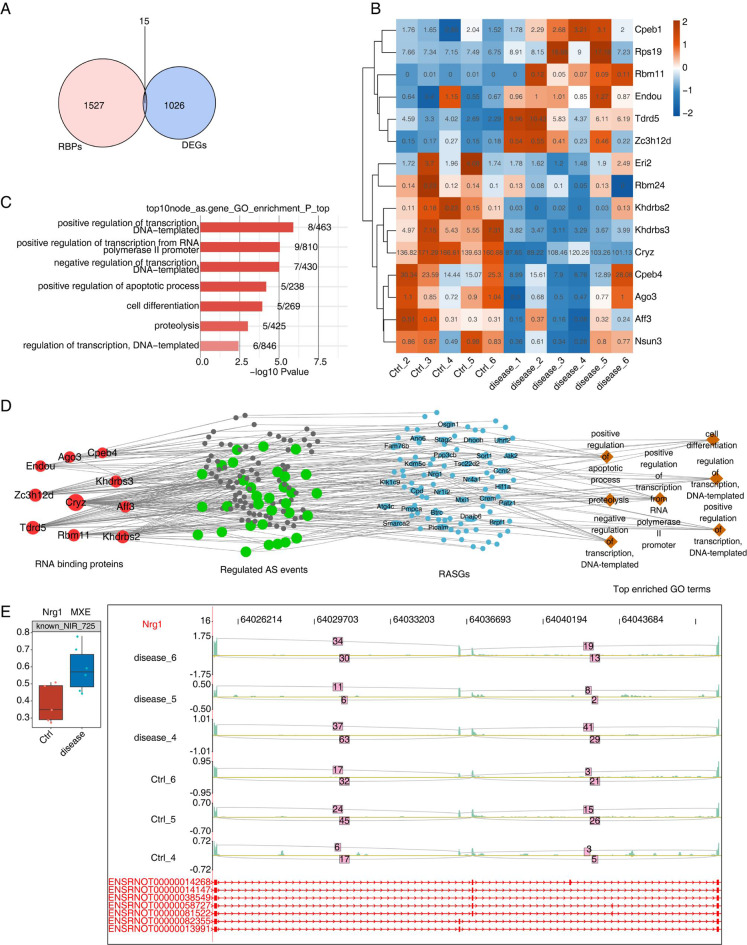
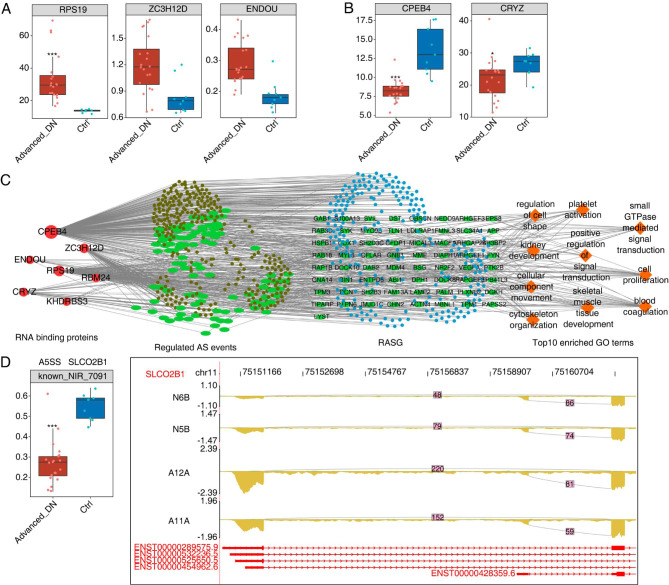
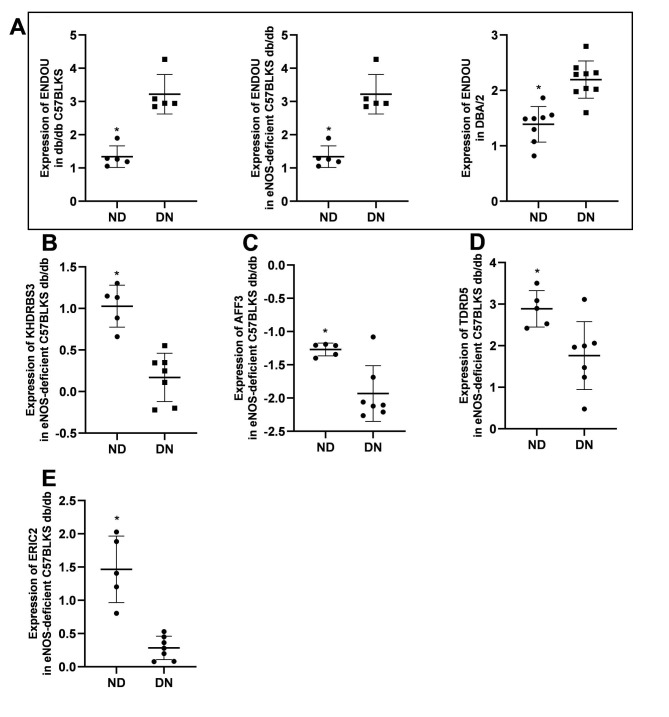
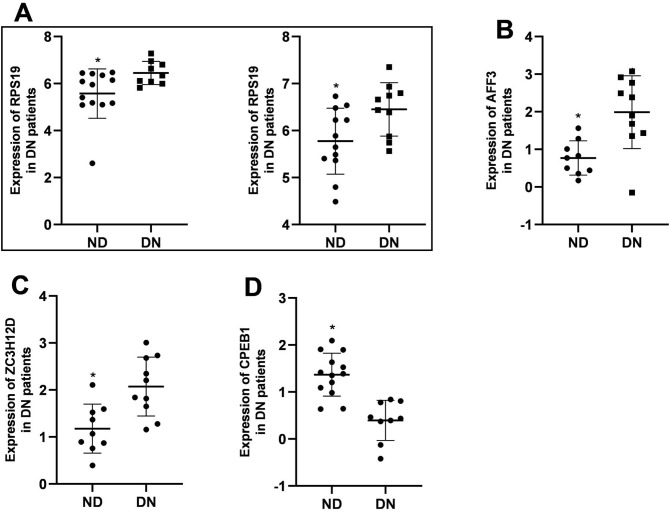
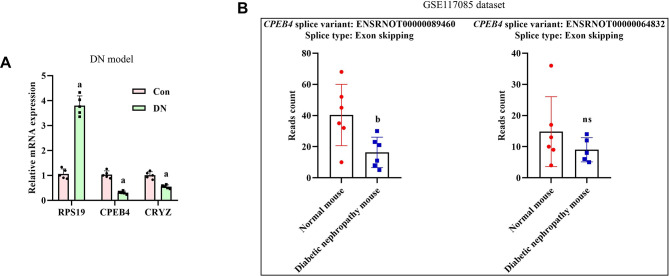
Results: Our analysis revealed 15 differentiated RBP genes and 423 RASEs in the kidney cortex of DN rats compared to controls. Enrichment analysis highlighted lipid metabolism pathways for RASGs. Seven of the identified RBPs were validated in kidney biopsy samples from DN patients versus controls. A co-deregulatory network was constructed based on dysregulated RBPs and RASEs, with select RASGs identified. In vivo experiments, compared to normal mice, the mRNA levels of RPS19 were significantly elevated in the renal tissues of DN mice, while the levels of CPEB4 and CRYZ were markedly decreased.
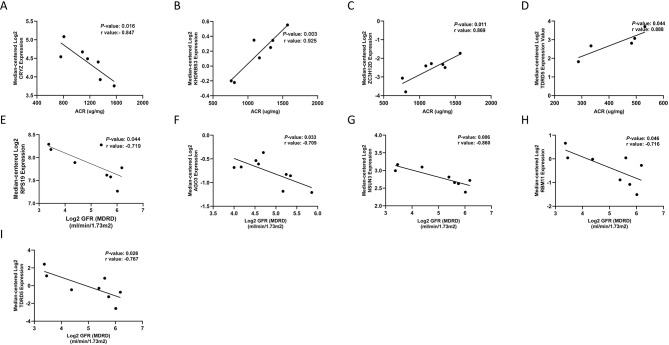
Conclusion: In conclusion, this study provides evidence implicating dysregulated RBPs and RBP-AS regulatory networks in the development of diabetic nephropathy. The validated RBPs exhibited close associations with clinical biomarkers, reinforcing their potential as therapeutic targets for DN. These findings enhance our understanding of the molecular basis of DN and offer new insights for future research and intervention strategies.
Clinical trial: Not applicable.
Keywords: Alternative splicing; Co-expression; Diabetic nephropathy; RNA binding protein; Transcriptome.
© 2025. The Author(s).
Conflict of interest statement
Declarations. Ethical approval: This study was approved by the IACUC (Institutional Animal Care and Use Committee) of Hubei Center for Disease Control and Prevention, Laboratory Animal Management and Use Committee (Ethical approval number: Safety Assessment Center (Fu) No. 202410271). The study adhered to the regulations for the management of experimental animals and/or met the ARRIVE 2.0 requirements. Consent to publish: Not applicable. Competing interests: The authors declare no competing interests.
Figures
Similar articles
-
ALDH18A1 has carcinogenic functions and regulates alternative splicing events of DNA repair-related genes in esophageal carcinoma cells.Sci Rep. 2025 Aug 7;15(1):28845. doi: 10.1038/s41598-025-08006-1. Sci Rep. 2025. PMID: 40770266 Free PMC article.
-
Identification and validation of epithelial‑mesenchymal transition‑related genes for diabetic nephropathy by WGCNA and machine learning.Mol Med Rep. 2025 Sep;32(3):249. doi: 10.3892/mmr.2025.13614. Epub 2025 Jul 11. Mol Med Rep. 2025. PMID: 40641111 Free PMC article.
-
Integrated approach of machine learning, Mendelian randomization and experimental validation for biomarker discovery in diabetic nephropathy.Diabetes Obes Metab. 2024 Dec;26(12):5646-5660. doi: 10.1111/dom.15933. Epub 2024 Oct 6. Diabetes Obes Metab. 2024. PMID: 39370621
-
Systemic pharmacological treatments for chronic plaque psoriasis: a network meta-analysis.Cochrane Database Syst Rev. 2021 Apr 19;4(4):CD011535. doi: 10.1002/14651858.CD011535.pub4. Cochrane Database Syst Rev. 2021. Update in: Cochrane Database Syst Rev. 2022 May 23;5:CD011535. doi: 10.1002/14651858.CD011535.pub5. PMID: 33871055 Free PMC article. Updated.
-
Systematic review on urine albumin testing for early detection of diabetic complications.Health Technol Assess. 2005 Aug;9(30):iii-vi, xiii-163. doi: 10.3310/hta9300. Health Technol Assess. 2005. PMID: 16095545
References
-
- Zhang L, Long J, Jiang W, et al. Trends in chronic kidney disease in China. N Engl J Med. 2016;375(9):905–6. - PubMed
-
- Lewis EJ, Hunsicker LG, Clarke WR, et al. Renoprotective effect of the angiotensin-receptor antagonist Irbesartan in patients with nephropathy due to type 2 diabetes. N Engl J Med. 2001;345(12):851–60. - PubMed
-
- Heerspink HJL, Stefánsson BV, Correa-Rotter R, et al. Dapagliflozin in patients with chronic kidney disease. N Engl J Med. 2020;383(15):1436–46. - PubMed
-
- Fineberg D, Jandeleit-Dahm KA, Cooper ME. Diabetic nephropathy: diagnosis and treatment. Nat Rev Endocrinol. 2013;9(12):713–23. - PubMed
MeSH terms
Substances
LinkOut - more resources
Full Text Sources
Medical
Research Materials
Miscellaneous
