

Comparing IOL refraction prediction accuracy and A-constant optimization for cataract surgery patients across South Indian and Midwestern United States populations
- PMID: 40597931
- PMCID: PMC12219035
- DOI: 10.1186/s12886-025-04217-2
Comparing IOL refraction prediction accuracy and A-constant optimization for cataract surgery patients across South Indian and Midwestern United States populations
Abstract
Background: IOL power selection is a key determinant of refractive outcomes after cataract surgery. Numerous formulas exist to aid in this process; some are derived from geometric-optical principles (e.g., SRK/T, Barrett) while others are based on data-driven and machine learning approaches (e.g., Nallasamy, Pearl-DGS). Given differences in ocular biometry and environmental stimuli, population-specific factors may impact the generalizability of certain formulas. This study compares clinical and biometric characteristics and evaluates the prediction accuracy of seven IOL power formulas, including machine learning–based approaches, in two distinct cataract surgery populations from South India and the Midwestern United States.
Methods: In this retrospective cross-sectional comparative study, data were collected from two tertiary care eye centers: University of Michigan’s Kellogg Eye Center (Ann Arbor, MI, USA) and Aravind Eye Hospital (Chennai, Tamil Nadu, India). The dataset included demographics, biometry power of the surgically implanted intraocular lens (IOL), and 1-month postoperative refraction. Seven IOL formulas were applied to predict postoperative refraction, and performance was assessed by comparing mean absolute errors both before and after population-specific A-constant optimization.
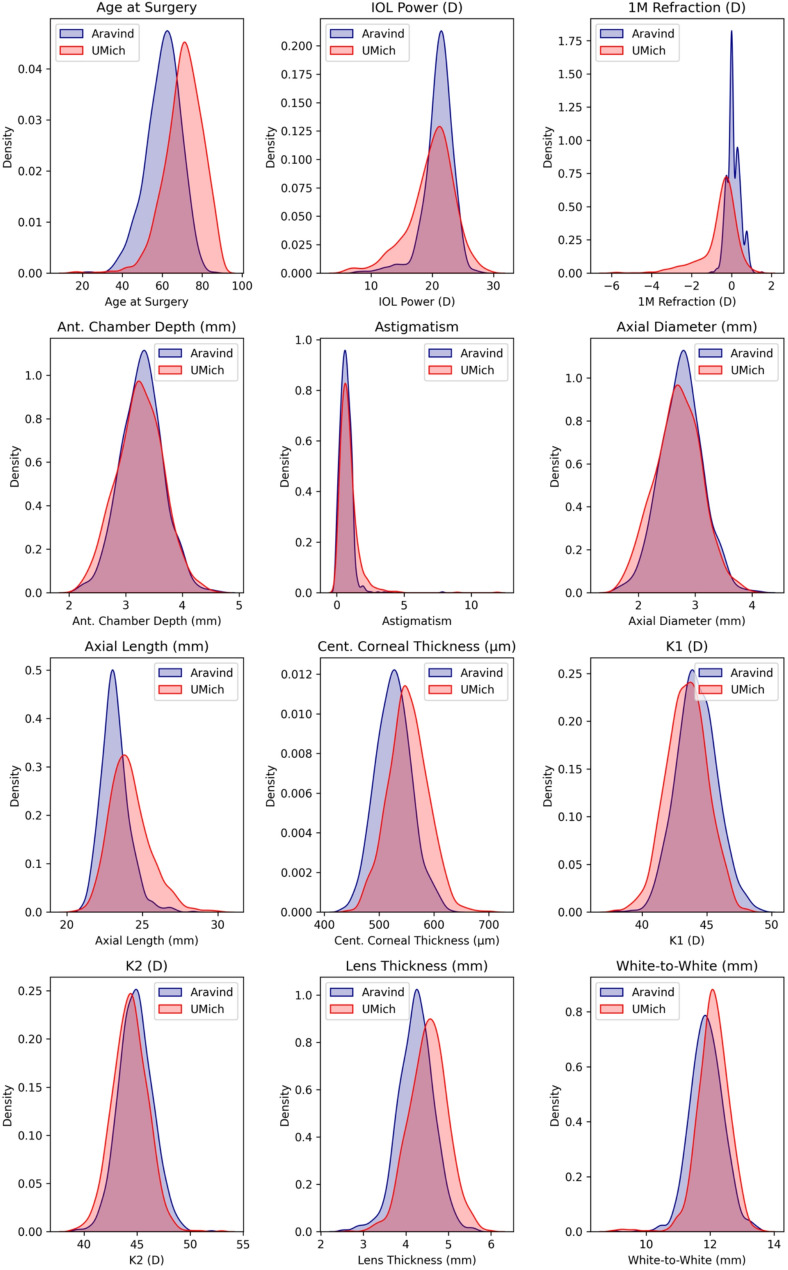
Results: A total of 985 eyes from Aravind (mean age 60.5 ± 9.5 years) and 1003 from UMich (mean age 70.7 ± 9.5) were analyzed. Aravind patients had significantly lower age, axial length, lens thickness, and central corneal thickness, while UMich patients had lower K measurements, IOL power, and postoperative refraction. Overall, formulas performed better in Aravind for the SN60WF lens. Before A-constant optimization on the Aravind dataset, one formula (Nallasamy) achieved mean absolute error under 0.25 diopters compared to four formulas (Nallasamy, Pearl-DGS, SRK/T, Barrett) afterwards.
Conclusions: Substantial clinical and biometric differences exist between South Indian and Midwestern US cataract populations. Machine learning-based IOL refraction prediction formulas performed the best on the South Indian dataset both before and after population-specific parameter optimization. Understanding population level differences and creating methods to integrate these factors into IOL formulas may help improve refractive outcomes in cataract surgery.
Supplementary Information: The online version contains supplementary material available at 10.1186/s12886-025-04217-2.
Keywords: Cataract surgery; IOL; Machine learning; Refractive outcomes.
Conflict of interest statement
Declarations. Ethics approval and consent to participate: The study was approved by the Indian Health Service Institutional Review Board (RET202100362) and by the Institutional Review Board at the University of Michigan (HUM00160950). Due to the retrospective and de-identified nature of the data utilized, it was determined by the institutional review boards that informed consent was not required. All research was carried out in accordance with the Declaration of Helsinki. Consent for publication: Not applicable. Competing interests: N.N. is a consultant for Recordati Rare Diseases, SARL.
Figures


References
-
- Lam D, Rao SK, Ratra V, et al. Cataract. Nat Rev Dis Primers. 2015;1(1):15014. 10.1038/nrdp.2015.14. - PubMed
-
- GBD 2019 Blindness and Vision Impairment Collaborators, Vision Loss Expert Group of the Global Burden of Disease Study. Causes of blindness and vision impairment in 2020 and trends over 30 years, and prevalence of avoidable blindness in relation to VISION 2020: the right to sight: an analysis for the global burden of disease study. Lancet Glob Health. 2021;9(2):e144–60. 10.1016/S2214-109X(20)30489-7. - PMC - PubMed
-
- Tavani A. Food and nutrient intake and risk of cataract. Ann Epidemiol. 1996;6(1):41–6. 10.1016/1047-2797(95)00099-2. - PubMed
-
- Ji Y, Cai L, Zheng T, et al. The mechanism of UVB irradiation induced-apoptosis in cataract. Mol Cell Biochem. 2015;401(1–2):87–95. 10.1007/s11010-014-2294-x. - PubMed
Grants and funding
LinkOut - more resources
Full Text Sources
Research Materials
