

An engineered hypoxia-response promoter for human umbilical cord-derived mesenchymal stem cell-based therapeutics
- PMID: 40597956
- PMCID: PMC12220557
- DOI: 10.1186/s12896-025-00993-3
An engineered hypoxia-response promoter for human umbilical cord-derived mesenchymal stem cell-based therapeutics
Abstract
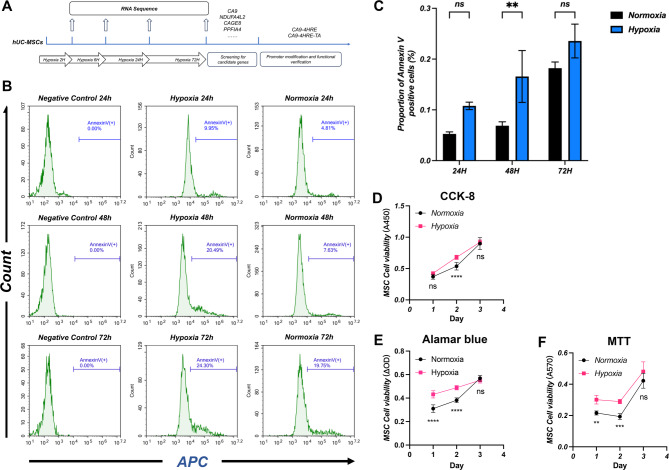
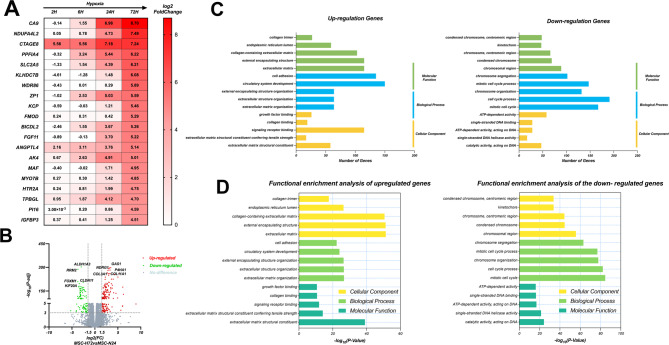
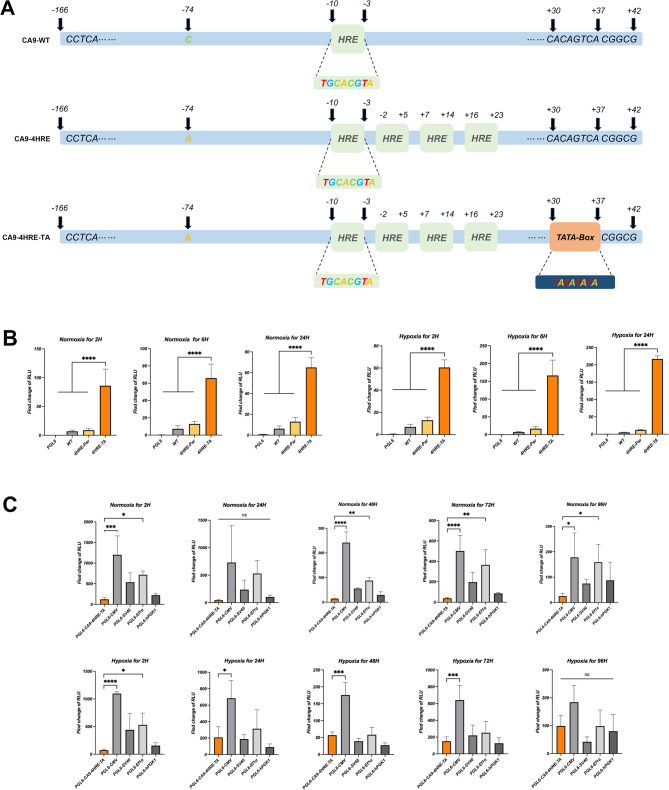
Myocardial infarction, characterized by insufficient blood supply to the heart, leads to ischemia and hypoxia of myocardial tissues, causing injury and decreased cardiac function. Despite improvements in pharmaceutical and interventional therapies, it remains a leading cause of death worldwide. Human umbilical cord mesenchymal stem cells (hUC-MSCs) play an important role in the repair of infarcted myocardium by promoting angiogenesis, reducing inflammation, secreting growth factors and cytokines. However, the harsh hypoxic microenvironment of infarcted myocardial tissue poses a threat to the survival and function of transplanted hUC-MSCs. In this study, we modified the candidate gene promoter of hUC-MSCs under hypoxic conditions and created a promoter that can respond quickly under hypoxic conditions. We found that the modified promoter significantly promoted the transcription efficiency as hypoxia time increased. This indicates that the engineered hypoxia-response promoter can effectively drive gene expression in a hypoxic environment. Furthermore, the transcription efficiency of the modified promoter under normoxic conditions is lower than that of common promoters in eukaryotic organisms, suggesting that this effect can improve the efficacy and safety of hUC-MSC-based myocardial infarction treatment by ensuring that cells function effectively in the damaged hypoxic area.
Keywords: Gene promoter modification; Human umbilical cord mesenchymal stem cells (hUC-MSCs); Hypoxia inducible factor (HIF); Hypoxia response element (HRE).
© 2025. The Author(s).
Conflict of interest statement
Declarations. Ethics approval and consent to participate: Not applicable. Competing interests: The authors declare no competing interests.
Figures
Similar articles
-
Cell Sheets Formation Enhances Therapeutic Effects of Human Umbilical Cord Mesenchymal Stem Cells on Spinal Cord Injury.CNS Neurosci Ther. 2024 Dec;30(12):e70163. doi: 10.1111/cns.70163. CNS Neurosci Ther. 2024. PMID: 39670537 Free PMC article.
-
Human umbilical cord mesenchymal stem cell-derived exosomes combined with mouse nerve growth factor can more effectively ameliorate the motor disorder and brain pathological injury in mice with cerebral palsy.Adv Clin Exp Med. 2025 Jun;34(6):911-923. doi: 10.17219/acem/192773. Adv Clin Exp Med. 2025. PMID: 39776315
-
Injection of human umbilical cord mesenchymal stem cells exosomes for the treatment of knee osteoarthritis: from preclinical to clinical research.J Transl Med. 2025 Jun 11;23(1):641. doi: 10.1186/s12967-025-06623-y. J Transl Med. 2025. PMID: 40500748 Free PMC article. Clinical Trial.
-
Umbilical Cord Matrix (Wharton Jelly) Mesenchymal Stem Cells in Next-generation Myocardial Repair and Regeneration: Mechanisms and Pre-clinical Evidence.Curr Cardiol Rev. 2025;21(5):76-103. doi: 10.2174/011573403X372908250117092252. Curr Cardiol Rev. 2025. PMID: 40012283 Review.
-
Cartilage Regeneration Using Human Umbilical Cord Blood Derived Mesenchymal Stem Cells: A Systematic Review and Meta-Analysis.Medicina (Kaunas). 2022 Dec 6;58(12):1801. doi: 10.3390/medicina58121801. Medicina (Kaunas). 2022. PMID: 36557003 Free PMC article.
References
-
- Fang J, Li JJ, Zhong X, et al. Engineering stem cell therapeutics for cardiac repair. J Mol Cell Cardiol Oct. 2022;171:56–68. 10.1016/j.yjmcc.2022.06.013. - PubMed
-
- Muller P, Lemcke H, David R. Stem cell therapy in heart Diseases - cell types, mechanisms and improvement strategies. Cell Physiol Biochem. 2018;48(6):2607–55. 10.1159/000492704. - PubMed
-
- Ni J, Liu X, Yin Y, Zhang P, Xu YW, Liu Z. Exosomes derived from TIMP2-Modified human umbilical cord mesenchymal stem cells enhance the repair effect in rat model with myocardial infarction possibly by the Akt/Sfrp2 pathway. Oxid Med Cell Longev. 2019;2019:1958941. 10.1155/2019/1958941. - PMC - PubMed
MeSH terms
Grants and funding
LinkOut - more resources
Full Text Sources
