

Identification of potential biomarkers and mechanisms for keloid disorder based on comprehensive bioinformatics analysis and machine learning algorithms
- PMID: 40598145
- PMCID: PMC12220631
- DOI: 10.1186/s12920-025-02174-9
Identification of potential biomarkers and mechanisms for keloid disorder based on comprehensive bioinformatics analysis and machine learning algorithms
Abstract
Background: Keloid disorder (KD) encompasses a spectrum of fibroproliferative dermal conditions, the pathogenesis remains complex and incompletely understood. This study sought to identify biomarkers and potential therapeutic targets for KD through an integrative bioinformatics approach and machine learning analysis of RNA sequencing data.
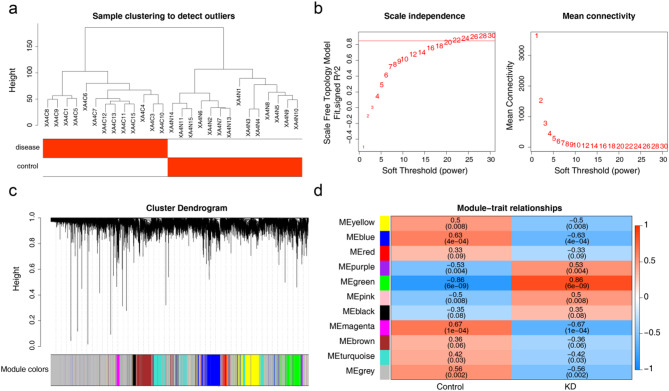
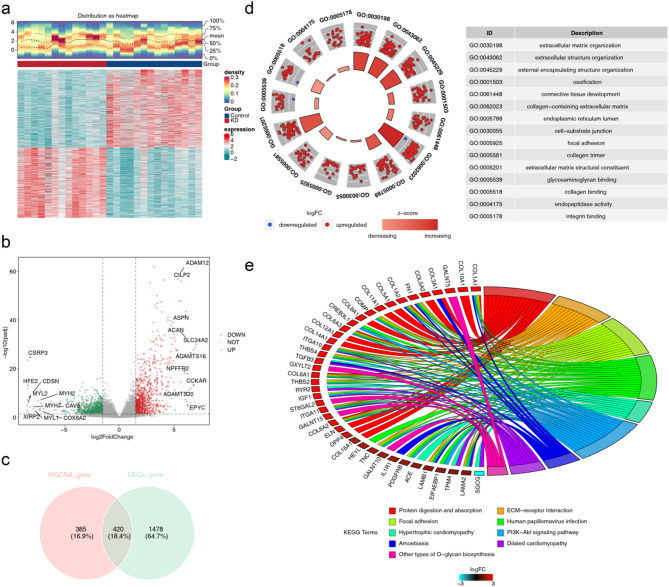
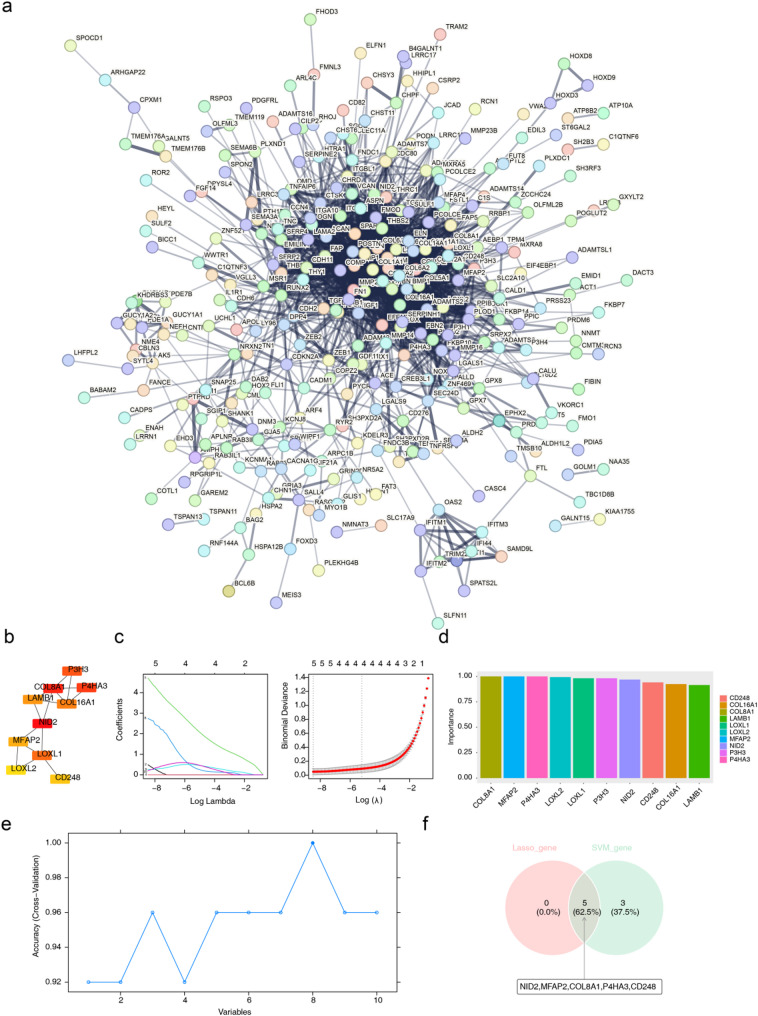
Methods: RNA sequencing was performed on skin tissue samples from 13 patients with KD and 14 healthy controls. Using weighted gene co-expression network analysis and differential expression analysis revealed differentially expressed key module genes, and the CytoHubba plugin identified candidate genes. Subsequently analyzed using least absolute shrinkage and selection operator (LASSO) and support vector machine recursive feature elimination (SVM-RFE) methods to pinpoint feature genes associated with KD. Following this, biomarkers were determined through expression level validation, enrichment analysis, and immune infiltration analysis.
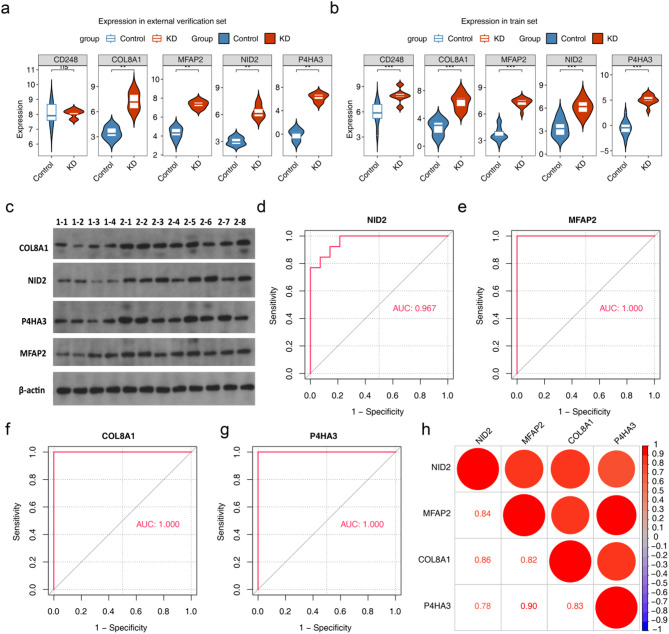
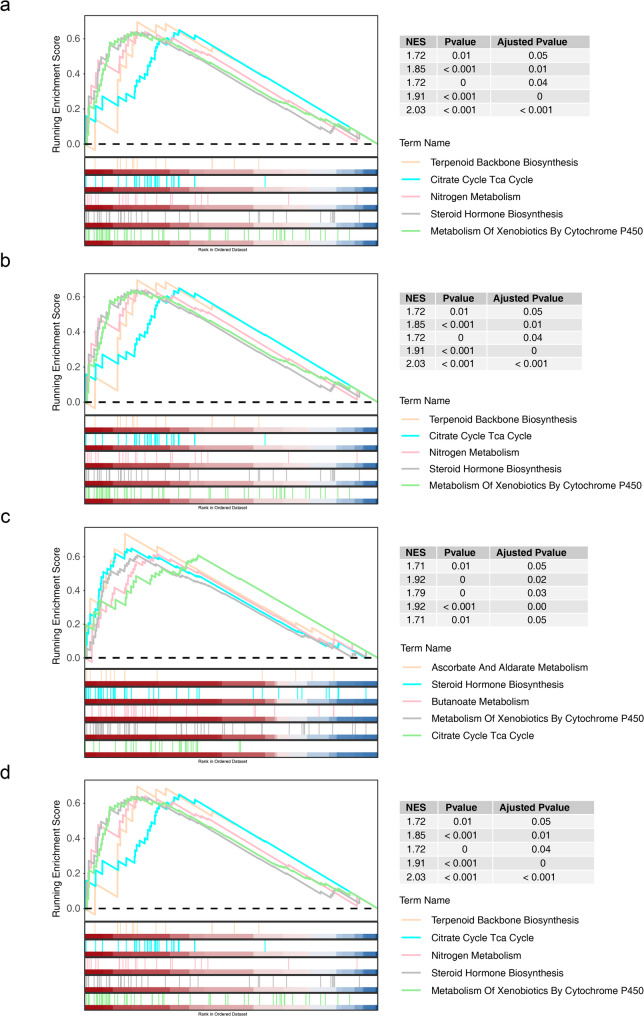
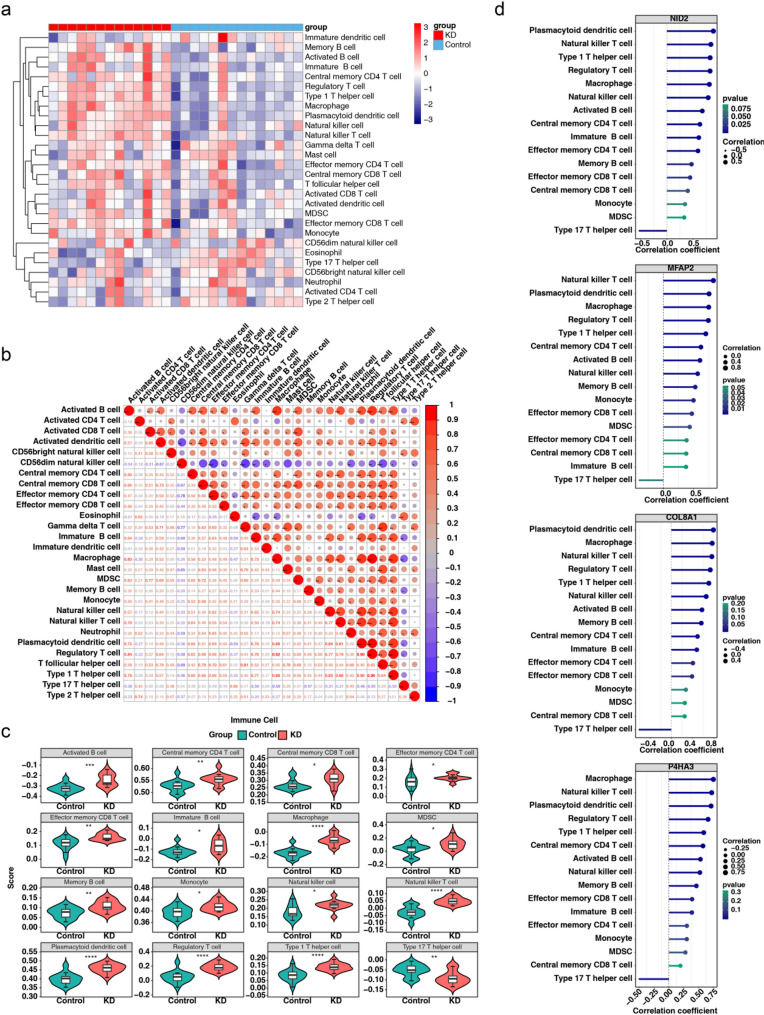
Results: A total of 420 differentially expressed key module genes were identified, and the top 10 genes with DMNC values were selected as candidate genes. Five feature genes were selected through LASSO and SVM-RFE, with NID2, MFAP2, COL8A1, and P4HA3 showing significant expression differences between KD and control samples, along with consistent expression patterns across datasets, identified as potential biomarkers. These four biomarkers were proved to possess high diagnostic potential, and they were found to exhibit significant positive correlations with one another. Functional enrichment analysis indicated that the primary KEGG pathways associated with these biomarkers included "steroid hormone biosynthesis" and "cytokine-cytokine receptor interaction." Moreover, immune infiltration analysis revealed that the four biomarkers were negatively correlated with type 17 T helper cells and positively correlated with 15 immune cell types, including activated B cells and central memory CD4 T cells.
Conclusion: In conclusion, NID2, MFAP2, COL8A1, and P4HA3 were identified as key biomarkers for KD, offering new avenues for more targeted and effective diagnostic and therapeutic strategies for managing this condition.
Keywords: Bioinformatics; Biomarker; Keloid disorder; Molecular mechanisms.
© 2025. The Author(s).
Conflict of interest statement
Declarations. Ethics approval and consent to participate: The studies involving human participants were reviewed and approved by the Ethic Committee of Lanzhou University Second Hospital. Informed consent to participate was obtained from all of the participants/ from the parents or legal guardians of the participants in the study. The patients/participants provided their written informed consent to participate in this study. All the experiments of this study were conducted in accordance to the relevant guidelines and regulations or in accordance to the Declaration of Helsinki and obtained informed consent from all participants. Consent for publication: Not Applicable. Competing interests: The authors declare no competing interests.
Figures
Similar articles
-
Machine learning based screening of biomarkers associated with cell death and immunosuppression of multiple life stages sepsis populations.Sci Rep. 2025 Aug 19;15(1):30302. doi: 10.1038/s41598-025-14600-0. Sci Rep. 2025. PMID: 40830558 Free PMC article.
-
Deciphering Shared Gene Signatures and Immune Infiltration Characteristics Between Gestational Diabetes Mellitus and Preeclampsia by Integrated Bioinformatics Analysis and Machine Learning.Reprod Sci. 2025 Jun;32(6):1886-1904. doi: 10.1007/s43032-025-01847-1. Epub 2025 May 15. Reprod Sci. 2025. PMID: 40374866
-
Machine learning and bioinformatics analysis to identify and validate diagnostic model associated with immune infiltration in rheumatoid arthritis.Clin Rheumatol. 2025 Jul;44(7):2683-2694. doi: 10.1007/s10067-025-07514-9. Epub 2025 Jun 11. Clin Rheumatol. 2025. PMID: 40500570
-
Systemic pharmacological treatments for chronic plaque psoriasis: a network meta-analysis.Cochrane Database Syst Rev. 2021 Apr 19;4(4):CD011535. doi: 10.1002/14651858.CD011535.pub4. Cochrane Database Syst Rev. 2021. Update in: Cochrane Database Syst Rev. 2022 May 23;5:CD011535. doi: 10.1002/14651858.CD011535.pub5. PMID: 33871055 Free PMC article. Updated.
-
Signs and symptoms to determine if a patient presenting in primary care or hospital outpatient settings has COVID-19.Cochrane Database Syst Rev. 2022 May 20;5(5):CD013665. doi: 10.1002/14651858.CD013665.pub3. Cochrane Database Syst Rev. 2022. PMID: 35593186 Free PMC article.
References
-
- Satish L, Lyons-Weiler J, Hebda PA, Wells A. Gene expression patterns in isolated keloid fibroblasts. Wound Repair Regen. 2006;14:463–70. - PubMed
-
- Verhaegen PDHM, van Zuijlen PPM, Pennings NM, van Marle J, Niessen FB, van der Horst CMAM, et al. Differences in collagen architecture between keloid, hypertrophic scar, normotrophic scar, and normal skin: an objective histopathological analysis. Wound Repair Regen. 2009;17:649–56. - PubMed
MeSH terms
Substances
Grants and funding
- number 24JRRA339/Natural Science Foundation of Gansu Province under Grant [number 24JRRA339]
- number 24JRRA339/Natural Science Foundation of Gansu Province under Grant [number 24JRRA339]
- number 24JRRA339/Natural Science Foundation of Gansu Province under Grant [number 24JRRA339]
- number 24JRRA339/Natural Science Foundation of Gansu Province under Grant [number 24JRRA339]
- number 24JRRA339/Natural Science Foundation of Gansu Province under Grant [number 24JRRA339]
LinkOut - more resources
Full Text Sources
Research Materials
