. 2025 Jul 1;23(1):315.
doi: 10.1186/s12964-025-02318-5.

Lycorine hydrochloride inhibits cholangiocarcinoma through cholesterol biosynthesis and PTPN11 nuclear translocation

Affiliations

Lycorine hydrochloride inhibits cholangiocarcinoma through cholesterol biosynthesis and PTPN11 nuclear translocation

Fengyun Zhao et al. Cell Commun Signal. .

Abstract

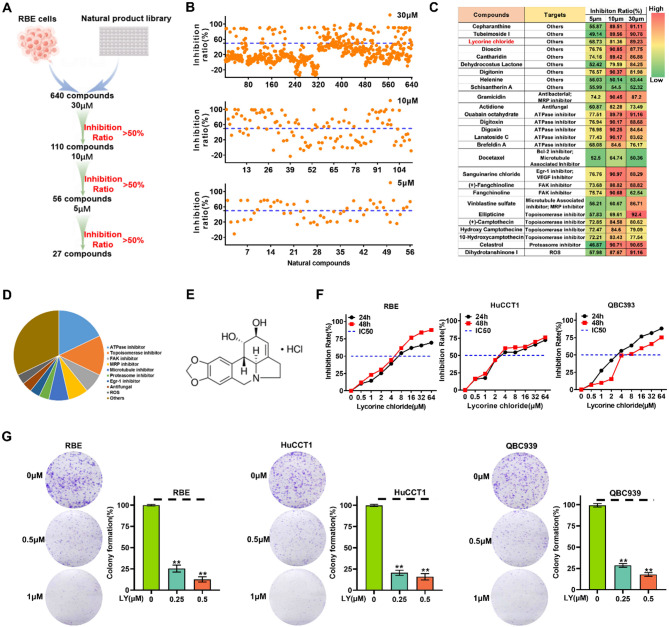
Background: Intrahepatic Cholangiocarcinoma (ICC) is a highly aggressive malignancy with limited treatment options. Identifying novel therapeutic agents for ICC is crucial. Numerous natural compounds have demonstrated remarkable anti-tumor activities and can enhance the efficacy of chemotherapy. Thus, our study aimed to screen natural compounds for their anti-ICC effects.

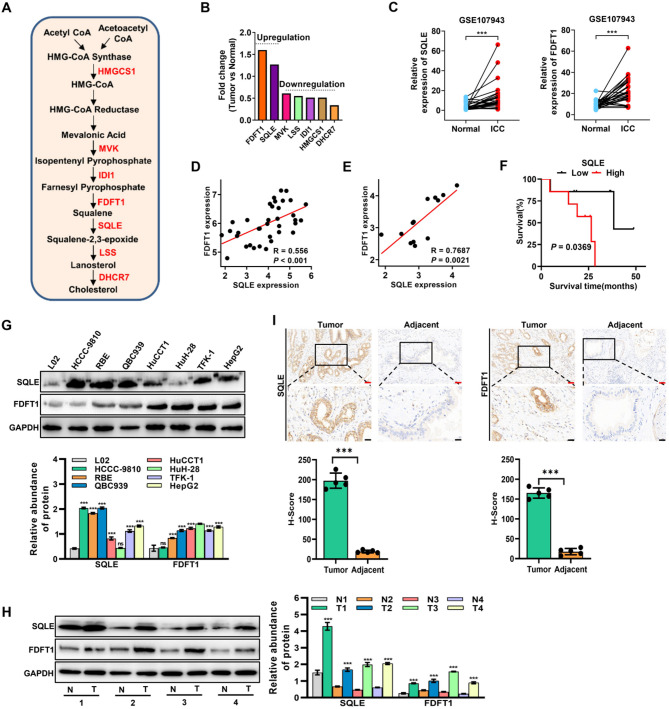
Methods: A total of 640 natural compounds were screened using a cell viability assay to identify potential compounds that could inhibit the proliferation of ICC cells. The anti-ICC effects of Lycorine Hydrochloride (LY) were confirmed through cell proliferation, colony formation, cell cycle, migration, and invasion assays, as well as in xenograft models. Bioinformatics analyses and validation experiments (Quantitative real-time PCR, Western blot, and immunostaining assays) were utilized to investigate the roles of genes (SQLE, FDFT1, and PTPN11) in ICC. RNA sequencing and immunofluorescence staining were performed to elucidate underlying molecular mechanisms.

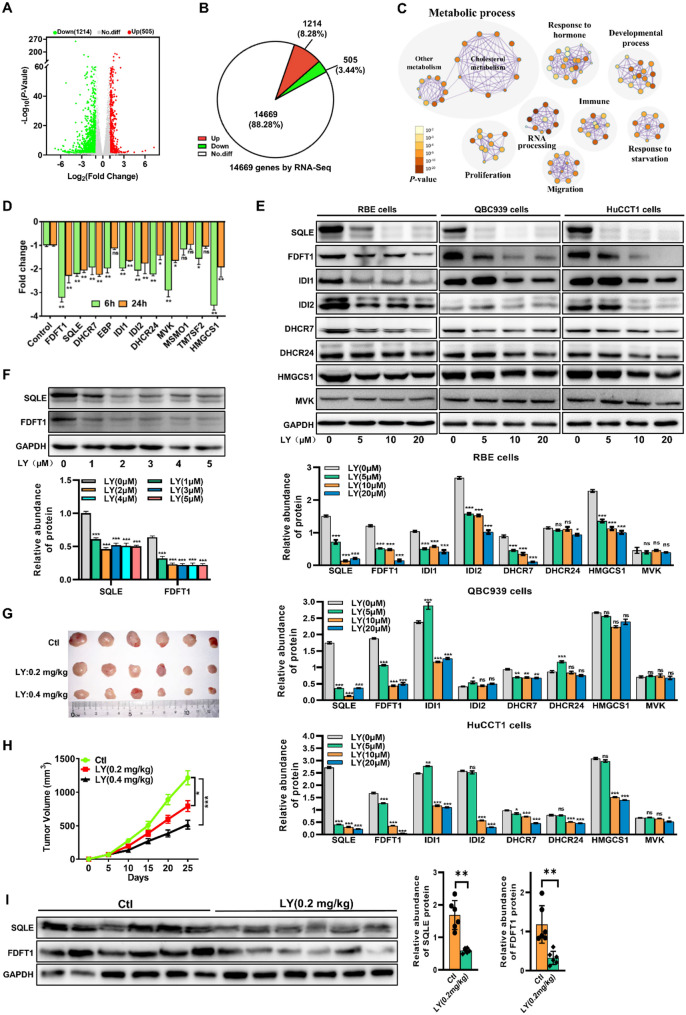
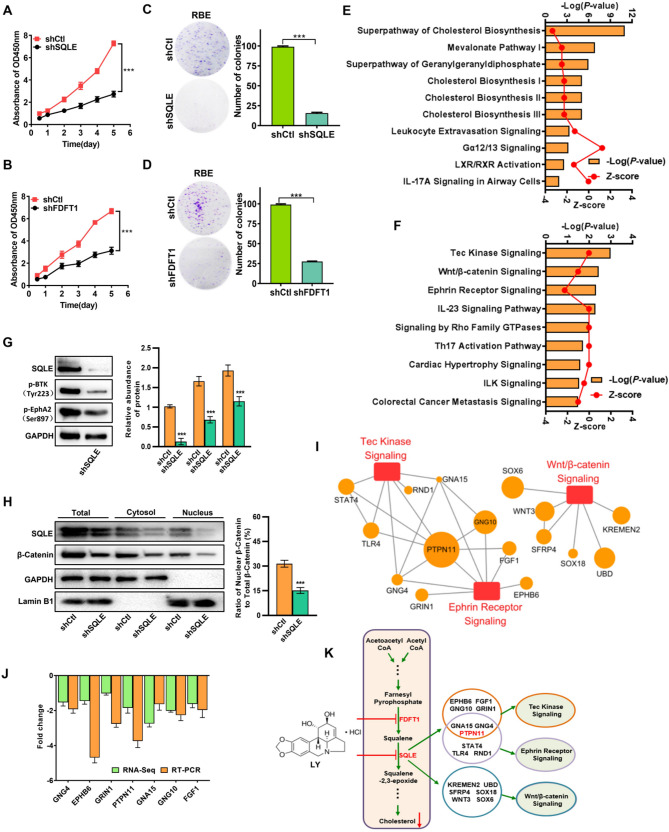
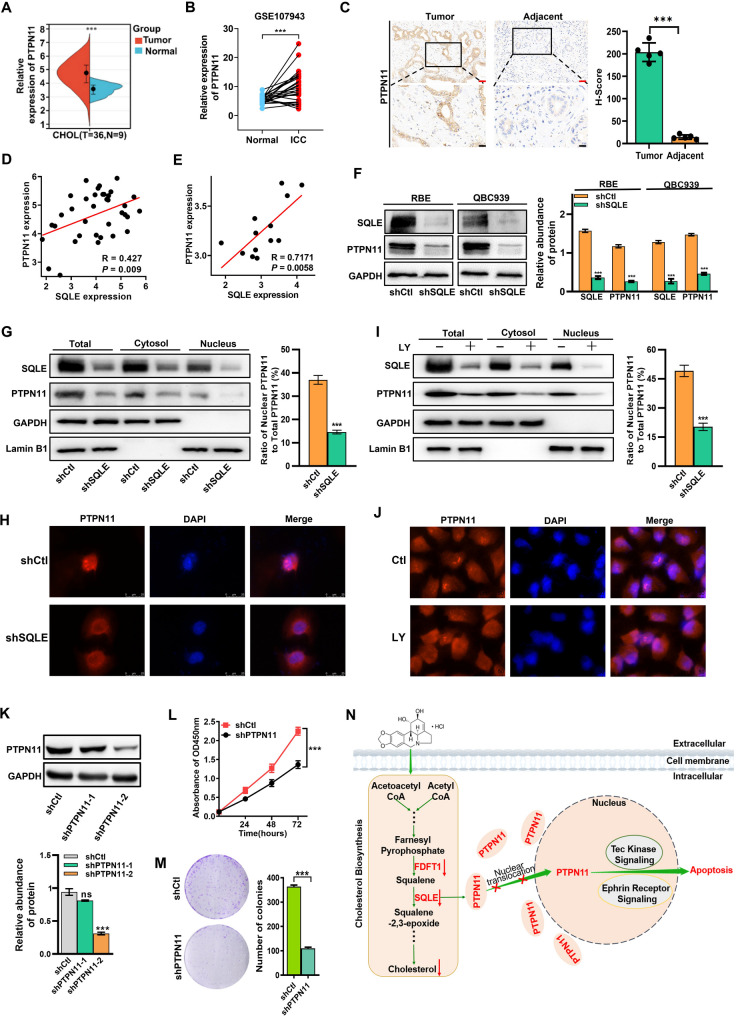
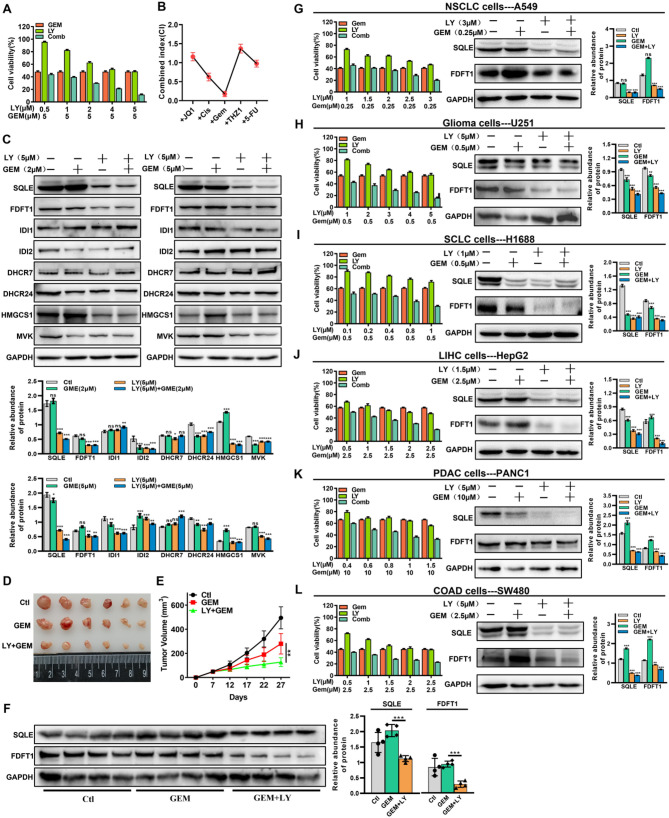
Results: LY was identified as a potential ICC inhibitor, exhibiting anti-ICC effects both in vitro and in vivo. Mechanistically, LY inhibited cholesterol synthesis in tumor cells by down-regulating the expression of SQLE and FDFT1. The knockdown of SQLE or FDFT1 significantly inhibited ICC cell proliferation and colony formation. RNA sequencing confirmed that inhibition of FDFT1 suppressed the cholesterol biosynthesis pathway, while SQLE inhibition affected specific oncogenic pathways. Additionally, immunofluorescence staining revealed that down-regulation of SQLE reduced PTPN11 expression and inhibited its nuclear translocation. Furthermore, pharmacological inhibition of SQLE and FDFT1 by LY significantly enhanced sensitivity to several common chemotherapeutic drugs for ICC. Notably, the combination of LY and Gemcitabine (GEM) displayed the most potent synergistic anti-tumor effect across various tumor types.

Conclusion: These findings identify Lycorine Hydrochloride as a promising treatment alternative for ICC and propose a novel combination strategy (LY + GEM) for treating multiple solid tumors.

Keywords: Cholangiocarcinoma; Cholesterol biosynthesis; FDFT1; Lycorine Hydrochloride; SQLE.


Conflict of interest statement

Declarations. Ethical approval: The protocol and any procedures involving the care and use of animals in this study were reviewed and approved by the Institutional Animal Care and Use Committee of Zhongshan City People’s Hospital. All the paraffin-embedded tissues of patients used in this study were obtained by informed patient consent. Competing interests: The authors declare no competing interests.

Figures

Fig. 1
Fig. 1
Screening of natural compounds revealed Lycorine Hydrochloride (LY) as a potential ICC inhibitor. (A) Flow chart showing the screening process of natural compounds. (B) Scatter plot showing the inhibition ratio of RBE cells treated with 640 natural compounds. (C) Distribution of putative targets and the inhibition ratio in RBE cells of the top 27 ranked natural compounds categorized and listed. (D) Pie chart displaying the distribution of targets of the top 27 natural compounds. (E) The chemical structure of LY (Molecular Formula: C17H20NO4+; Formula Weight: 302.35). (F) The cell viability of RBE cells after 24–48 h incubation with different concentrations of LY. (G) The colony formation assay to determine the dose-dependent inhibitory effect of LY on ICC cells. The number of colonies was counted under a microscope. Data are presented as mean ± SD of three simultaneously performed experiments (B, F and G). *P < 0.05, **P < 0.01, ***P < 0.001
Fig. 2
Fig. 2
Lycorine Hydrochloride affected cholesterol metabolism in ICC via SQLE and FDFT1. (A) A volcano plot showing the differentially expressed genes (DEGs) between treatment and non-treatment of LY as determined by the RNA-seq analysis. (B) RNA-seq identified 14,669 genes expressed, among which 505 genes were up-regulated and 1214 genes were down-regulated. (C) Pathway enrichment of the DEGs in RBE cells treated with LY for 24 h. Metascape was used to conduct pathway enrichment, and the network was visualized using Cytoscape 3.8.2. Network of enriched terms, circles are Ontology (GO) terms, colored by P value, where terms containing more genes tend to have a more significant P value. (D) The mRNA expression profile of the DEGs associated with the cholesterol biosynthesis pathway in RBE cells treated with LY for 6 h and 24 h. ns, not significant; RNA expression levels are presented as log2 fold change (log2 FC) relative to the control group; negative values indicate downregulation. (E) Western blot results showing the protein expression level of the DEGs in the cholesterol biosynthesis pathway in different ICC cells after treatment with 0, 5, 10, 20 µM LY for 24 h. (F) Western blot results showing the protein expression level of FDFT1 and SQLE in RBE cells after treatment with 0, 1, 2, 3, 4, 5 µM LY for 24 h. (G and H) Representative tumor image (G) and tumor volume (H) of RBE cells-derived xenografts treated with different concentrations of LY or PBS (Ctl group), n = 6. (I) The protein expression of SQLE and FDFT1 in the tumor tissues from mouse xenograft models of RBE cells (n = 6). Data are presented as mean ± SD of three simultaneously performed experiments (D-F and I). *P < 0.05, **P < 0.01, ***P < 0.001
Fig. 3
Fig. 3
FDFT1 and SQLE have oncogenic roles in ICC. (A) Schematic diagram of the cholesterol biosynthesis-related genes. (B) The expression level of seven cholesterol biosynthetic-associated genes in ICC tissues from TCGA database. (C) The expression level of SQLE (left) and FDFT1 (right) in 27 pairs of ICC tumor and adjacent liver tissues from GEO database (GSE107943). (D) Spearman’s correlation analysis of the expression of SQLE and FDFT1 in CHOL patients from TCGA database (n = 36). (E) Spearman’s correlation analysis of the expression of SQLE and FDFT1 in ICC organoids (GSE215997, n = 13). (F) The OS analysis of human ICC samples from GSE107943 based on SQLE expression. (G) The protein expression level of FDFT1 and SQLE in human normal liver cells (L02) and ICC cell lines. (H) The protein expression level of FDFT1 and SQLE in tumor tissues and adjacent normal tissues of ICC patients. (I) Representative IHC analysis of SQLE and FDFT1 expression in paired adjacent and tumorous tissues from ICC patients (n = 5 pairs, 10 tissues in total). Red scale bar: 50 μm; Black scale bar: 20 μm. Data are presented as means ± SD of three simultaneously performed experiments (G and H). *P < 0.05, **P < 0.01, ***P < 0.001
Fig. 4
Fig. 4
Silencing FDFT1 and SQLE inhibits the proliferation of ICC. (A-B) Cell proliferation was measured after SQLE (A) or FDFT1 (B) silencing in RBE cells. (C-D) The effect of SQLE (C) or FDFT1 (D) knockdown on colony formation in RBE cells. (E and F) IPA canonical pathways analysis of the DEGs identified via RNA-seq in RBE cells stably transfected with shFDFT1 (E) or shSQLE (F), compared with RBE cells stably transfected with shcontrol (shCtl). (G) Western blot validation of Tec kinase and Ephrin receptor signaling pathways in shCtl- and shSQLE-transfected RBE cells. Phosphorylated BTK (Y223) and Phospho-EPHA2 (S897) levels were detected to assess pathway activation. (H) Subcellular distribution of β-catenin in shCtl- and shSQLE-transfected RBE cells. Cytoplasmic and nuclear fractions were separated, and β-catenin levels were detected by Western blot. GAPDH (cytoplasmic marker) and Lamin B1 (nuclear marker) served as loading controls. Total β-catenin levels were calculated as the sum of cytoplasmic and nuclear fractions. (I) The top three enriched pathways and their corresponding DEGs in SQLE silenced RBE cells. The red boxes represent the signaling pathways, whereas the orange circles represent the associated genes. The size of each circle was determined by the -Log10(P value) associated with the respective gene. (J) Real-time PCR validation of the expression profile of some DEGs from RNA-seq data; RNA expression levels are presented as log2 fold change (log2 FC) relative to the control group; negative values indicate downregulation. (K) Schematic illustration that LY negatively regulates the cholesterol biosynthesis pathway through inhibiting FDFT1 and SQLE, and inhibition of SQLE exerts anti-ICC effect by influencing multiple signaling pathways. Data are presented as means ± SD of three simultaneously performed experiments (A-D, G-H, J). *P < 0.05, **P < 0.01, ***P < 0.001
Fig. 5
Fig. 5
SQLE inhibits PTPN11 nuclear translocation. (A) The expression level of PTPN11 in ICC tissues (T, n = 36) and adjacent liver tissues (N, n = 9) from TCGA database. (B) The expression level of PTPN11 in 27 pairs of ICC tumor and adjacent liver tissues from GEO database (GSE107943). (C) Representative IHC analysis of PTPN11 expression in paired adjacent and tumorous tissues from ICC patients (n = 5 pairs, 10 tissues in total). Red scale bar: 50 μm; Black scale bar: 20 μm. (D and E) Spearman’s correlation analysis for the expression of PTPN11 in CHOL patients from TCGA database (n = 36) (D) or ICC organoids (E) (GSE215997, n = 13). (F) Expression of PTPN11 after SQLE knockdown in ICC cells. (G) Western blot analysis of PTPN11 expression in nuclear, cytoplasmic, and total protein fractions in shNC (shCtl) and shSQLE RBE cells. (H) Immunofluorescence staining was performed to determine the expression of PTPN11 in RBE cells with or without SQLE knockdown. (I) Western blot analysis of PTPN11 expression in nuclear, cytoplasmic, and total protein fractions in RBE cells with or without LY (1.0 µM) for 24 h. (J) Immunofluorescence staining was performed to determine the expression of PTPN11 in RBE cells with or without LY (1.0 µM) for 24 h. (K) Knockdown of PTPN11 in RBE cells was confirmed by Western blot. (L) The proliferation of RBE cells was measured through the CCK-8 viability assay after PTPN11 silencing. (M) The effect of PTPN11 knockdown on colony formation in RBE cells. (N) Schematic illustration that LY negatively regulates the cholesterol biosynthesis pathway via inhibiting FDFT1 and SQLE, and inhibition of SQLE exerted anti-ICC effect by regulating the nuclear translocation of PTPN11. Data are presented as means ± SD of three simultaneously performed experiments (F to M). *P < 0.05, **P < 0.01, ***P < 0.001
Fig. 6
Fig. 6
LY synergistically interacts with chemotherapy agents. (A) Cell proliferation was measured in RBE cells after 24 h treatment of LY in combination with different concentrations of GEM. (B) Combination index (CI) of LY combined with different drugs was determined using CalcuSyn software. (C) Western blot analyzed the expression level of cholesterol biosynthetic associated genes in RBE cells treated with LY in combination with GEM (2 µM or 5 µM). (D and E) Representative tumor image (D) and tumor volume (E) of RBE cells-derived xenografts treated with GEM or GEM in combination with LY (n = 6). (F) Western blot analyzed the expression level of SQLE and FDFT1 in tumor tissues of RBE cells-derived xenografts. (G-L). A549 cells (G), U251 cells (H), H1688 cells (I), HepG2 cells (J), PNAC1 cells (K) and SW480 cells (L) were treated with LY in combination with different concentrations of GEM for 24 h, cell viability was measured by using CCK-8 method, and Western blot was used to analyze the protein expression level of SQLE and FDFT1. Data are presented as means ± SD of three simultaneously performed experiments (A-C, F-L). *P < 0.05, **P < 0.01, ***P < 0.001

Similar articles

References

    1. Moris D, Palta M, Kim C, Allen PJ, Morse MA, Lidsky ME. Advances in the treatment of intrahepatic cholangiocarcinoma: an overview of the current and future therapeutic landscape for clinicians. CA Cancer J Clin. 2023;73:198–222. - PubMed
    1. Ilyas SI, Affo S, Goyal L, Lamarca A, Sapisochin G, Yang JD, et al. Cholangiocarcinoma - novel biological insights and therapeutic strategies. Nat Rev Clin Oncol. 2023;20:470–86. - PMC - PubMed
    1. Valle J, Wasan H, Palmer DH, Cunningham D, Anthoney A, Maraveyas A, et al. Cisplatin plus gemcitabine versus gemcitabine for biliary tract cancer. N Engl J Med. 2010;362:1273–81. - PubMed
    1. Kelley RK, Bridgewater J, Gores GJ, Zhu AX. Systemic therapies for intrahepatic cholangiocarcinoma. J Hepatol. 2020;72:353–63. - PubMed
    1. Bian X, Liu R, Meng Y, Xing D, Xu D, Lu Z. Lipid metabolism and cancer. J Exp Med 218 (2021). - PMC - PubMed

MeSH terms